Is there evidence that the mean social marginality scores are not the same for all four age groups? Test the relevant hypotheses using a = .01 by filling in the blanks below Age Group Youths Adults Adults Seniors Let MM2 M3 M4 be the mean social Sample Size 106 255 314 36 marginality scores for the 4 given populations. x 2.00 3.40 3.07 2.84 S 1.56 1.68 1.66 1.89 State the null and alternative hypothesis. Ho: Ha: Where the μi are the mean social marginality scores as indicated above. Use your calculator list's feature to solve the values below. N= און 2 = SSTr= Treatment df = SSE = T=Grand Total = Error df= F = Show your work in space at right = P-value (calculator generated) Drawing a picture may help you calculate the p-value of this F distribution. Conclusion: (p-value vs alpha, reject/fail to reject Ho) 5: In a research study, the accompanying summary statistics for a measure of social marginality for samples of youths, young adults, adults, and seniors appeared. The social marginality score measured actual and perceived social rejection, with higher scores indicating greater social rejection. For purposes of this exercise, assume all required assumptions are met. Is there evidence that the mean social marginality scores are not the same for all four age groups? <>
Is there evidence that the mean social marginality scores are not the same for all four age groups? Test the relevant hypotheses using a = .01 by filling in the blanks below Age Group Youths Adults Adults Seniors Let MM2 M3 M4 be the mean social Sample Size 106 255 314 36 marginality scores for the 4 given populations. x 2.00 3.40 3.07 2.84 S 1.56 1.68 1.66 1.89 State the null and alternative hypothesis. Ho: Ha: Where the μi are the mean social marginality scores as indicated above. Use your calculator list's feature to solve the values below. N= און 2 = SSTr= Treatment df = SSE = T=Grand Total = Error df= F = Show your work in space at right = P-value (calculator generated) Drawing a picture may help you calculate the p-value of this F distribution. Conclusion: (p-value vs alpha, reject/fail to reject Ho) 5: In a research study, the accompanying summary statistics for a measure of social marginality for samples of youths, young adults, adults, and seniors appeared. The social marginality score measured actual and perceived social rejection, with higher scores indicating greater social rejection. For purposes of this exercise, assume all required assumptions are met. Is there evidence that the mean social marginality scores are not the same for all four age groups? <>

Glencoe Algebra 1, Student Edition, 9780079039897, 0079039898, 2018
18th Edition
ISBN:9780079039897
Author:Carter
Publisher:Carter
Chapter10: Statistics
Section10.4: Distributions Of Data
Problem 19PFA

Related questions
Question
T45
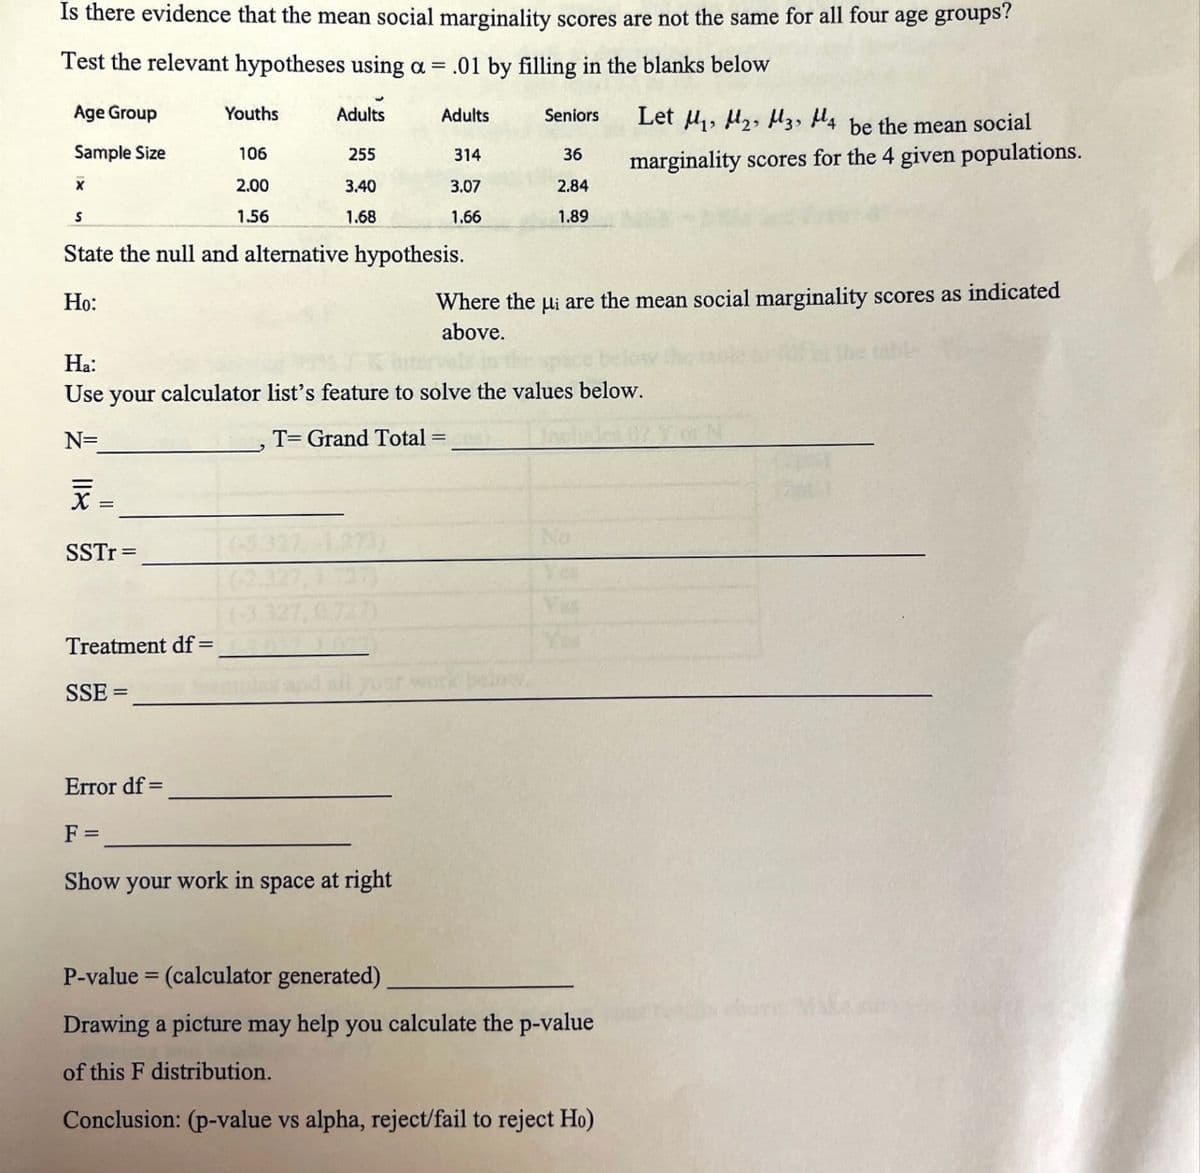
Transcribed Image Text:Is there evidence that the mean social marginality scores are not the same for all four age groups?
Test the relevant hypotheses using a = .01 by filling in the blanks below
Age Group
Youths
Adults
Adults
Seniors
Let MM2 M3 M4 be the mean social
Sample Size
106
255
314
36
marginality scores for the 4 given populations.
x
2.00
3.40
3.07
2.84
S
1.56
1.68
1.66
1.89
State the null and alternative hypothesis.
Ho:
Ha:
Where the μi are the mean social marginality scores as indicated
above.
Use your calculator list's feature to solve the values below.
N=
און
2
=
SSTr=
Treatment df =
SSE =
T=Grand Total =
Error df=
F =
Show your work in space at right
=
P-value (calculator generated)
Drawing a picture may help you calculate the p-value
of this F distribution.
Conclusion: (p-value vs alpha, reject/fail to reject Ho)
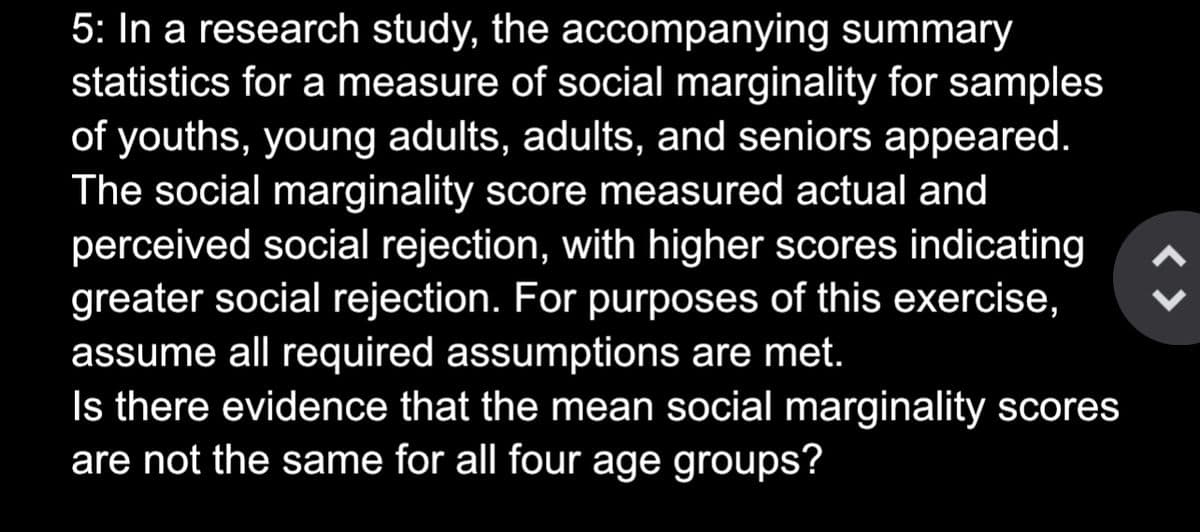
Transcribed Image Text:5: In a research study, the accompanying summary
statistics for a measure of social marginality for samples
of youths, young adults, adults, and seniors appeared.
The social marginality score measured actual and
perceived social rejection, with higher scores indicating
greater social rejection. For purposes of this exercise,
assume all required assumptions are met.
Is there evidence that the mean social marginality scores
are not the same for all four age groups?
<>
Expert Solution
This question has been solved!
Explore an expertly crafted, step-by-step solution for a thorough understanding of key concepts.

This is a popular solution!

Trending now
This is a popular solution!

Step by step
Solved in 2 steps

Recommended textbooks for you
Glencoe Algebra 1, Student Edition, 9780079039897…
Algebra
ISBN:
9780079039897
Author:
Carter
Publisher:
McGraw Hill
Glencoe Algebra 1, Student Edition, 9780079039897…
Algebra
ISBN:
9780079039897
Author:
Carter
Publisher:
McGraw Hill