A statistical program is recommended. You may need to use this table to answer this question. The following data show the daily closing prices (in dollars per share) for a stock. Date Nov. 3 Nov. 4 Nov. 7 Nov. 8 Nov. 9 Nov. 10 Nov. 11 Nov. 14 Nov. 15 Nov. 16 Nov. 17 Nov. 18 Nov. 21 Nov. 22 Nov. 23 Nov. 25 Nov. 28 Nov. 29 Nov. 30 Dec. 1 Price ($) 82.95 82.94 83.57 83.19 82.75 83.95 84.60 84.35 85.62 86.55 86.83 87.81 87.36 87.96 88.81 88.79 89.20 89.15 88.88 89.14 (a) Define the independent variable Period, where Period = 1 corresponds to the data for November 3, Period = 2 corresponds to the data for November 4, Period = 3 corresponds to the data for November 7, and so on. Develop the estimated regression equation that can be used to predict the closing price (in dollars per share) given the value of Period. Use x for Period. (Round your numerical values to two decimal places.) ŷ =
A statistical program is recommended. You may need to use this table to answer this question. The following data show the daily closing prices (in dollars per share) for a stock. Date Nov. 3 Nov. 4 Nov. 7 Nov. 8 Nov. 9 Nov. 10 Nov. 11 Nov. 14 Nov. 15 Nov. 16 Nov. 17 Nov. 18 Nov. 21 Nov. 22 Nov. 23 Nov. 25 Nov. 28 Nov. 29 Nov. 30 Dec. 1 Price ($) 82.95 82.94 83.57 83.19 82.75 83.95 84.60 84.35 85.62 86.55 86.83 87.81 87.36 87.96 88.81 88.79 89.20 89.15 88.88 89.14 (a) Define the independent variable Period, where Period = 1 corresponds to the data for November 3, Period = 2 corresponds to the data for November 4, Period = 3 corresponds to the data for November 7, and so on. Develop the estimated regression equation that can be used to predict the closing price (in dollars per share) given the value of Period. Use x for Period. (Round your numerical values to two decimal places.) ŷ =

MATLAB: An Introduction with Applications
6th Edition
ISBN:9781119256830
Author:Amos Gilat
Publisher:Amos Gilat
Chapter1: Starting With Matlab
Section: Chapter Questions
Problem 1P

Related questions
Question
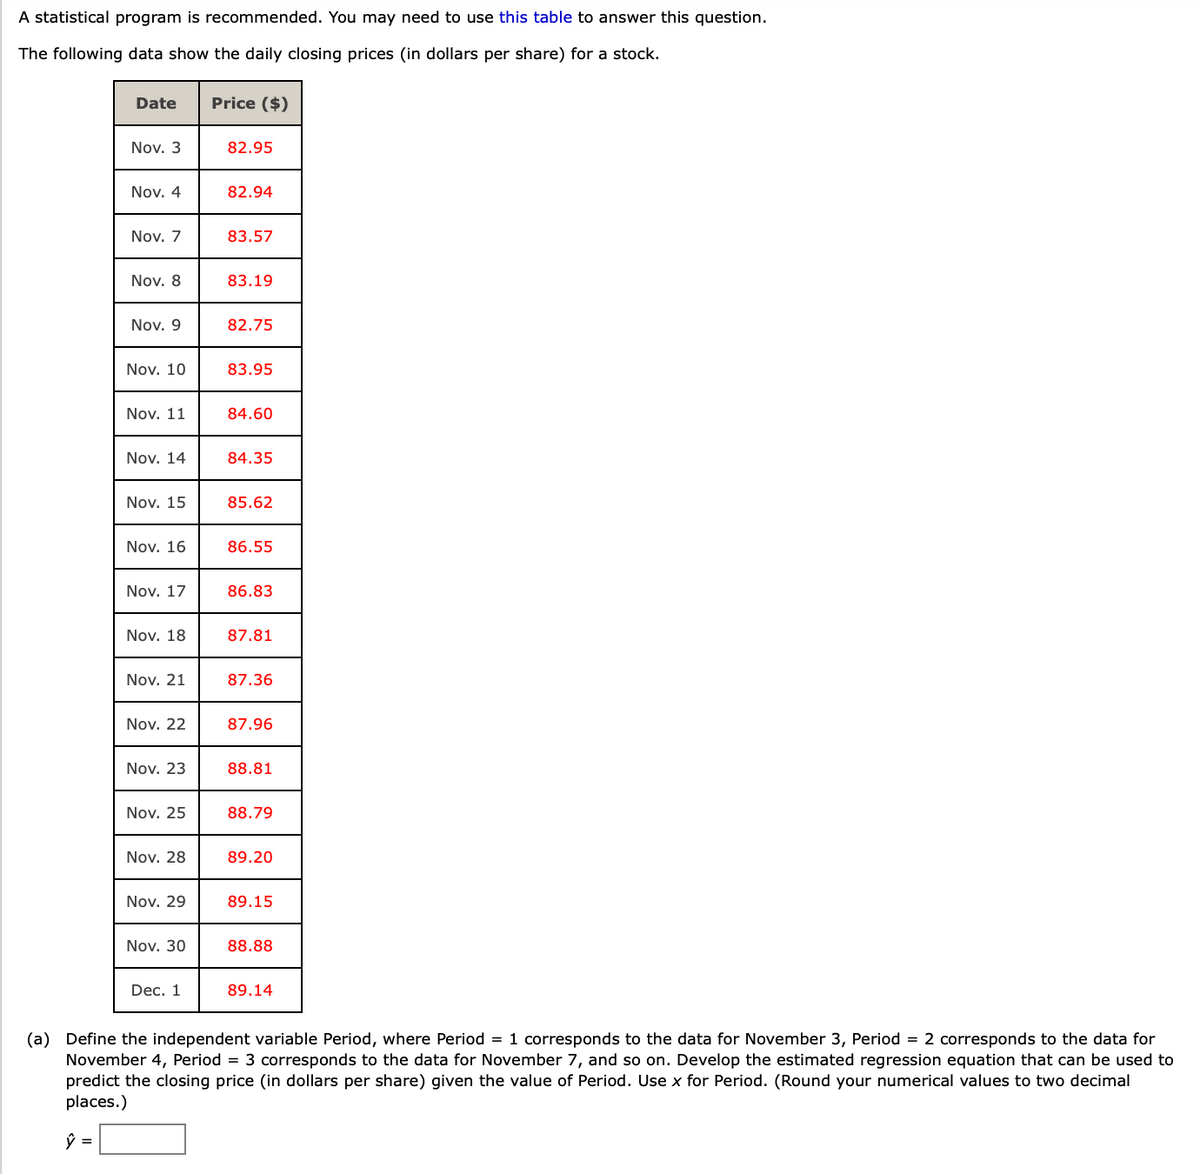
Transcribed Image Text:A statistical program is recommended. You may need to use this table to answer this question.
The following data show the daily closing prices (in dollars per share) for a stock.
Date
Nov. 3
Nov. 4
Nov. 7
Nov. 8
Nov. 9
Nov. 10
Nov. 11
Nov. 14
Nov. 15
Nov. 16
Nov. 17
Nov. 18
Nov. 21
Nov. 22
Nov. 23
Nov. 25
Nov. 28
Nov. 29
Nov. 30
Dec. 1
Price ($)
82.95
82.94
83.57
83.19
82.75
83.95
84.60
84.35
85.62
86.55
86.83
87.81
87.36
87.96
88.81
88.79
89.20
89.15
88.88
89.14
(a) Define the independent variable Period, where Period = 1 corresponds to the data for November 3, Period = 2 corresponds to the data for
November 4, Period = 3 corresponds to the data for November 7, and so on. Develop the estimated regression equation that can be used to
predict the closing price (in dollars per share) given the value of Period. Use x for Period. (Round your numerical values to two decimal
places.)
ŷ =
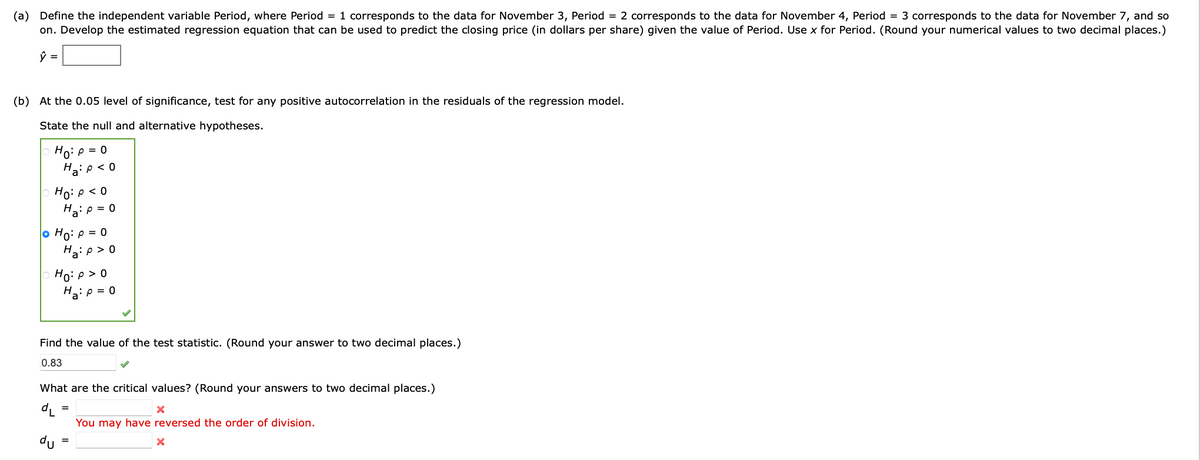
Transcribed Image Text:(a) Define the independent variable Period, where Period = 1 corresponds to the data for November 3, Period = 2 corresponds to the data for November 4, Period = 3 corresponds to the data for November 7, and so
on. Develop the estimated regression equation that can be used to predict the closing price (in dollars per share) given the value of Period. Use x for Period. (Round your numerical values to two decimal places.)
(b) At the 0.05 level of significance, test for any positive autocorrelation in the residuals of the regression model.
State the null and alternative hypotheses.
Ho: P = 0
Ha: p<0
Ho: P < 0
Ha:p = 0
Ho: p=0
Ha:p>0
Ho: P > 0
Ha: p = 0
Find the value of the test statistic. (Round your answer to two decimal places.)
0.83
What are the critical values? (Round your answers to two decimal places.)
dL=
du
X
You may have reversed the order of division.
X
Expert Solution
This question has been solved!
Explore an expertly crafted, step-by-step solution for a thorough understanding of key concepts.

This is a popular solution!

Trending now
This is a popular solution!

Step by step
Solved in 4 steps with 15 images

Recommended textbooks for you
MATLAB: An Introduction with Applications
Statistics
ISBN:
9781119256830
Author:
Amos Gilat
Publisher:
John Wiley & Sons Inc

Probability and Statistics for Engineering and th…
Statistics
ISBN:
9781305251809
Author:
Jay L. Devore
Publisher:
Cengage Learning

Statistics for The Behavioral Sciences (MindTap C…
Statistics
ISBN:
9781305504912
Author:
Frederick J Gravetter, Larry B. Wallnau
Publisher:
Cengage Learning
MATLAB: An Introduction with Applications
Statistics
ISBN:
9781119256830
Author:
Amos Gilat
Publisher:
John Wiley & Sons Inc
Probability and Statistics for Engineering and th…
Statistics
ISBN:
9781305251809
Author:
Jay L. Devore
Publisher:
Cengage Learning
Statistics for The Behavioral Sciences (MindTap C…
Statistics
ISBN:
9781305504912
Author:
Frederick J Gravetter, Larry B. Wallnau
Publisher:
Cengage Learning

Elementary Statistics: Picturing the World (7th E…
Statistics
ISBN:
9780134683416
Author:
Ron Larson, Betsy Farber
Publisher:
PEARSON

The Basic Practice of Statistics
Statistics
ISBN:
9781319042578
Author:
David S. Moore, William I. Notz, Michael A. Fligner
Publisher:
W. H. Freeman

Introduction to the Practice of Statistics
Statistics
ISBN:
9781319013387
Author:
David S. Moore, George P. McCabe, Bruce A. Craig
Publisher:
W. H. Freeman