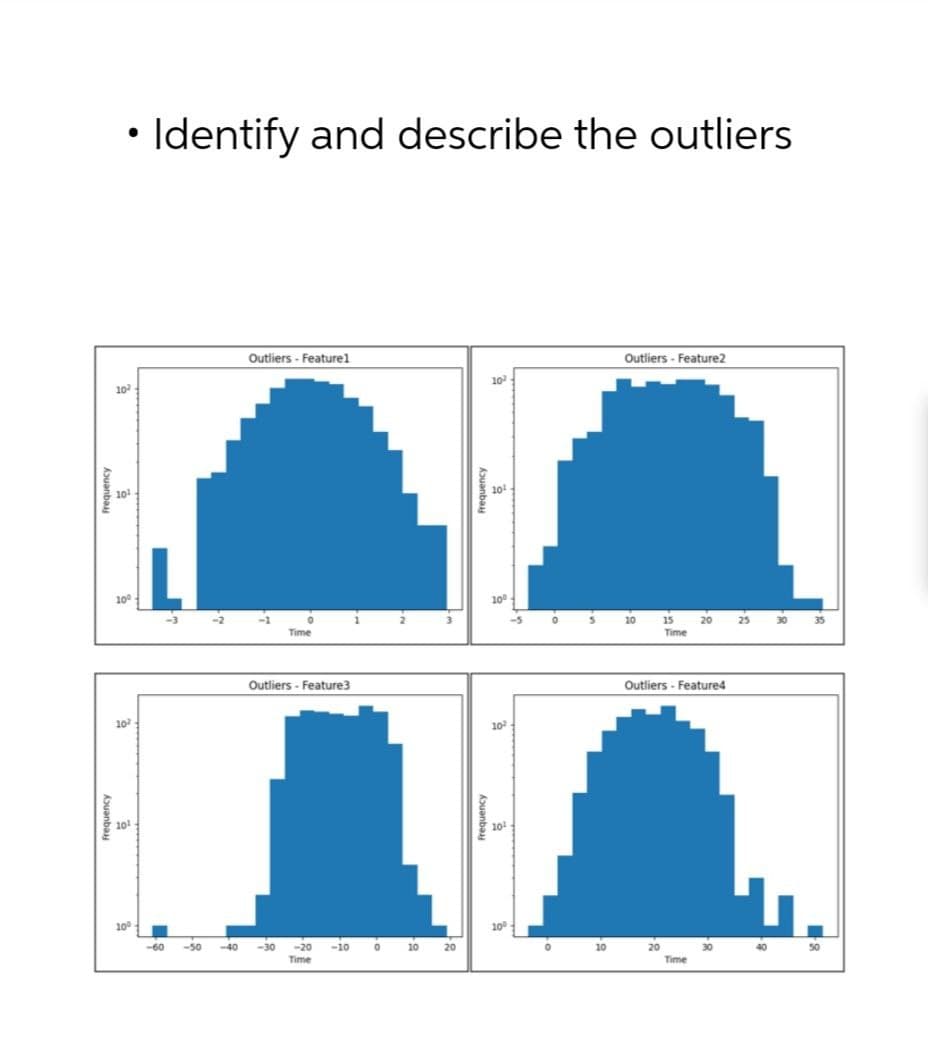
Frequency • Identify and describe the outliers Outliers - Feature1 10 10 OF Frequency 101 100 OOF 10 101 100 -60 2- Time Outliers - Feature3 -50 <-40 -30 -20 -10 Time Lo 10 Frequency 10 호 Frequency 10 10° 10 20 10 O n 2 Outliers - Feature2 10 15 Time 20 20 Outliers - Feature4 20 Time 30 225 25 8. 35 50


Q: A company sells their products online. The partially completed table below shows the probability of…
A: The probability that the company sells at least one product First, find the missing probability then…
Q: where did you get the service time from
A: The service times for each customer in the simulation are determined by using the frequencies given…
Q: ence to support the researcher's clam? Assume the samples are random and dependent, and the…
A: The question is about hypothesis testing.Given :Number of males selected ( n ) = 10Sprint time…
Q: There are "m+4" rows and 7 columns in a chi-squared distribution table.There are 25 (n=25) samples.…
A: The question is about the degree of freedom of the chi-square test.The chi-square distribution table…
Q: A student wanted to know if M & Ms follow their stated distribution. Here is what the company…
A: Goodness of fitExplanation:We are given the probability distribution of the M & Ms. Next, we are…
Q: a) Use the data shown above to construct a 97% confidence interval estimate for the mean amount of…
A: Let be the population mean amount of cold medication in each bottle.Given that,Sample size…
Q: R² measures the percentage of variation in the dependent variable explained by The degrees of…
A: The objective is to identify the appropriate option that describes the measured percentage variation…
Q: Company XYZ know that replacement times for the DVD players it produces are normally distributed…
A: The objective of the question is to find the probability that a randomly selected DVD player will…
Q: Situation: The Ipod Touch has been out for two years now and a lot of data has been…
A: The linear model that best fits this data is:s=T(p)=-0.31p+255 B. The squared correlation…
Q: 3.4.7 Consider the Markov chain whose transition probability matrix is given by 0 1 2 3 0|| 1 0 0 0…
A: Given the Markov chain with transition probability matrix:
Q: A researcher claims that a post-lunch nap decreases the amount of time it takes males to sprint 20…
A: The question is about hypothesis testing.Given :No. of males selected ( n ) = 10 MaleSprint time…
Q: The state and local police departments are trying to analyze crime rates so they can shift their…
A: The 12-month data of one area isMonthCrime Incidencesample sizeCrime…
Q: The amount of paint required to paint a surface with an area of 50 m2 is normally distributed with…
A: The objective of this question is to find the probability that the entire surface can be painted…
Q: What does this plot show about the model being analysed? What is the R code needed to generate this…
A: The Normal QQ plot is given.Interpret the given plot.
Q: Tensile strength tests were carried out on two different grades of wire rod resulting in the…
A: 95% confidence interval for difference between true average strengths for the two grades: (-16.741,…
Q: This answer is wrong according to the program that I use for homework. Can you please check your…
A: To find P(T≤1) for a random variable T that follows a Gamma distribution with parameters α=4 (shape…
Q: A tire manufacturer believes that the tread life of its snow tires can be described by a Normal…
A: Population mean=32000Population standard deviation=2500
Q: The Eastern and Western Major League Soccer conferences have a new Reserve Division that allows new…
A: a) H0: μE = μW H1: μE ≠ μWb) t = -1.44 (rounded to two decimals)c) p = 0.1813 (rounded to four…
Q: ndard deviation of 0.010 ounces. A case consists of 24 bottles randomly sampled from the output of…
A: n=24,μx=24.01,σx=0.01Note: According to bartelby question answer guidelines an expert can solve only…
Q: In simple linear regression of a sample of 25 data points, if the correlation equals 0, the standard…
A: The objective of this question is to understand the relationship between the correlation coefficient…
Q: Why is it important to make sure that the measures you use in your research projects are valid an…
A: The objective of this question is to understand the importance of validity and reliability in…
Q: In simple linear regression of a sample of 25 data points, if the correlation equals 0, the standard…
A: The objective of this question is to understand the relationship between the correlation coefficient…
Q: The lifetime, in years, of a type of small electric motor operating under adverse conditions is…
A: The objective of this question is to find the probability that fewer than six motors fail within one…
Q: Find the following z values for the standard normal variable Z. (You may find it useful to reference…
A: Since you have posted a question with multiple sub parts, we will provide the solution only to the…
Q: college is trying to determine if there is a significant difference in the mean GMAT score of…
A: Information has been provided regarding the GMAT scores of MBA students based on their background…
Q: Required Information How much noisier are streets where cars travel faster? An article reports noise…
A: The data on speed and noise levels is given…
Q: of 502 randomly selected U.S. adults interviewed said they would not be bothered if the National…
A: Hypothesis testing of population proportion is used to check whether the proportion is equal to the…
Q: Consider the following data representing the price of plasma televisions (in dollars).…
A: The objective of the question is to determine the upper class boundary for the fifth class in the…
Q: (****) A continuous random variable X has probability density function (PDF) for some constants a…
A: X is a continuous random variable having a probability density function
Q: 1. Which of the following scatterplots would show the highest r. Which one would give the lowest r?…
A: 1. Plot number 2 is the scatterplot with the highest r-value, indicating a strong positive…
Q: Suppose you are asked to evaluate a new staff training program to reduce wait times at the…
A: a) In the equation Yi = Bo + B1Ti + Ei, where Yi represents the wait time, Ti represents the…
Q: Please do not rely too much on chatgpt, because its answer may be wrong. Please consider it…
A: (i) P(S3 = 2) = p3 3p2r (ii) P(S4 = 1 | S1 =1 ) = p x r2 (iii) P(S10 =1 | S7 = 0 ) = q3 x p3 (iv)…
Q: Please do not rely too much on chatgpt, because its answer may be wrong. Please consider it…
A: Answer (b); Yes, the chain is aperiodic. Answer (c):Answer (i):…
Q: The popularity of computer, video, online, and virtual reality games has raised concerns that they…
A: The given tabulated data is as follows:Grad AverageA's and B'sC'sD's and F'sPlayed…
Q: The heights of adult men in America are normally distributed, with a mean of 69.6 inches and a…
A: The objective of this question is to calculate the z-scores for a man and a woman based on their…
Q: continue the question
A: Given that the portfolio is homogeneous with an average number of claims per year of 75, the mean,…
Q: Calculate the z-score of the given x value, x = 52, where u = 46.6 and σ = 41.9. Round your answer…
A: Random variable X with mean, μ=46.6 and standard deviation =41.9.To find the Z score at X=52
Q: Problem 1. Suppose there is a box of cash consisting of $1, $2, $5, $10, 20$, 50$, 100$ bills, and…
A: The normal worth of the bill is roughly $26.86Explanation:To find the normal worth of the bill, we…
Q: data given below represent the number of males and females in a work group who feel overstressed and…
A: By applying the chi-square test for independence,Observed frequency (O)…
Q: according to the bureau of labor statistics the average number of weeks an individuals is unemployes…
A: ANSWER :PROBABILITY = 0.3616Explanation:LetX :number of weeks an individuals is unemployedGiven mean…
Q: Which of the following is true of skip questions? Skip questions are not a problem with online…
A: The closest statement to being true about skip questions is:If an interviewer (or respondent on a…
Q: A genetic experiment with peas resulted in one sample of offspring that consisted of 442 green peas…
A: The question is about confidence interval.Given :Total no. of green peas ( y ) = 442Total no. of…
Q: 1. Assume X, are independent and identically distributed with P(X₁ = 1) = p, P(X₁ = 0) = r and P(X₁…
A: In order to demonstrate that the sequencce {S1, S2,...} forms an irreducible Markov chain with a set…
Q: A discrete random variable x follows uniform distribution and takes the values 6, 8,10, 12, 18. The…
A:
Q: A student at a four-year college claims that mean enrollment at four-year colleges is higher than at…
A: From the given data ,5466 , = 50688191 , 477735 , 35Significance level , 0.10
Q: A marketing firm wants to know if there is a difference in the best marketing strategy for new…
A: The objective of this question is to calculate the expected value for the number of sales generated…
Q: Macmillan Learning P(X 2 X 1) = About 3% of children in the United States are allergic to peanuts.…
A: In this case, each of the children has the only options of "being allergic to peanuts" (defined as…
Q: Not apart of assignment, practice work
A: Below is the simplified answer....!Explanation:Step 1: Step 2: Step 3: Step 4:
Q: Day Actual Jobs Sunday 80 Monday 65 Tuesday 50 Wednesday 100 Thursday 100 Friday 130…
A: intercept = 47 Explanation:Step 1: Give a numerical value for each day in order to be able to make…
Q: Let T ∼ Γ (r, λ). If μT = 8 and r = 8.00, find λ and σ2T . (Round the final answer to one decimal…
A: T~Γ(r,λ)If μT = 8 and r = 8.00Formula Mean=rλVariance=rλ2

Step by step
Solved in 3 steps

- The measurement of spread or scatter of the individual values around the central point is called: a. Measures of kurtosis b. Measures of dispersion c. mean d. Measures of skewnessDescribe the pattern that you see. How strong is the pattern? The scatterplot exhibits a ---Select--- (weak linear, weak nonlinear, strong nonlinear, strong linear) pattern. Do you see any outliers or clusters? There ---Select--- (are no outliers, is one outlier, are two outliers, are more than two outliers) and ---Select--- (no clusters, one cluster, two clusters, more than two clusters) on the scatterplot.Describe the pattern that you see. How strong is the pattern?The scatterplot exhibits a ---Select--- (weak linear, weak nonlinear, strong nonlinear, strong linear) pattern. Do you see any outliers or clusters?There ---Select--- (are no outliers, is one outlier, are two outliers, are more than two outliers) and ---Select--- (no clusters, one cluster, two clusters, more than two clusters) on the scatterplot.
- Lydia wanted to know if sons of taller fathers tend to be taller. Here are the heights of the fathers and sons in Lydia’s sample: Here is Lydia’s description of the scatterplot:There is a positive linear association between fathers’ heights and sons’ heights. There are a few potential outliers. What, if anything, is missing from this description? Form Direction Strength Outliers Nothing is missing; this is a completeSubject: Discrete StructuresQuestion: Based on the partial data showing the Presidentiables (rows) are paired to Vice presidentiables (column) What are chances of Bong Bong Marcos winning assuming he will join with Bong Go?The Coruro’s Burrow. The subterranean coruro (Spalacopus cyanus) is a social rodent that lives in large colonies in underground burrows that can reach lengths of up to 600 meters. Zoologists S. Begall and M. Gallardo studied the characteristics of the burrow systems of the subterranean coruro in central Chile and published their findings in the paper “Spalacopus cyanus (Rodentia: Octodontidae): An Extremist in Tunnel Constructing and Food Storing among Subterranean Mammals” (Journal of Zoology, Vol. 251, pp. 53–60). A sample of 51 burrows had the depths, in centimeters (cm), presented on the WeissStats site. Use the technology of your choice to do the following. a. Obtain a normal probability plot, boxplot, histogram, and stemand-leaf diagram of the data. b. Based on your results from part (a), can you reasonably apply the t-interval procedure to the data? Explain your reasoning. c. Find and interpret a 90% confidence interval for the mean depth of all subterranean coruro burrows.
- The measurements of spread or scatter of the individual values around the central point is called a. Measures of dispersion b. Measures of kurtosis c. Measures of central tendency This d. Measures of skewnessA zero correlation between X and Y is least likely to ocurr if A. The plot of points for X and Y form a parabola B. The plot of points for X and Y form a cloud pattern C. The plot of points for X and Y almost fit on a straight line with 45 degree incline D. The plot of points for X and Y almost fit on a straight line with a 90 degree inclineApplications of SLE Curve: Fitting
- Question content area Part 1 Aspen Plastics produces plastic bottles to customer order. The quality inspector randomly selects four bottles from the bottle machine and measures the outside diameter of the bottle neck, a critical quality dimension that determines whether the bottle cap will fit properly. The dimensions (in.) from the last six samples are Bottle Sample 1 2 3 4 1 0.576 0.593 0.618 0.580 2 0.580 0.583 0.602 0.586 3 0.571 0.599 0.612 0.578 4 0.570 0.601 0.603 0.594 5 0.596 0.618 0.589 0.571 6 0.610 0.609 0.578 0.605 LOADING... Click the icon to view the table of factors for calculating three-sigma limits for the x-chart and R-chart. Part 2 Suppose that the specification for the bottle neck diameter is 0.600±0.050 in. and the population standard deviation is 0.014 in. a. What is the process capability index? The Cpk is enter your response here. (Enter…Critical Path Analysis Draw the graph Compute the Critical Path of the graph. Complete the CPM table and identify the critical path

