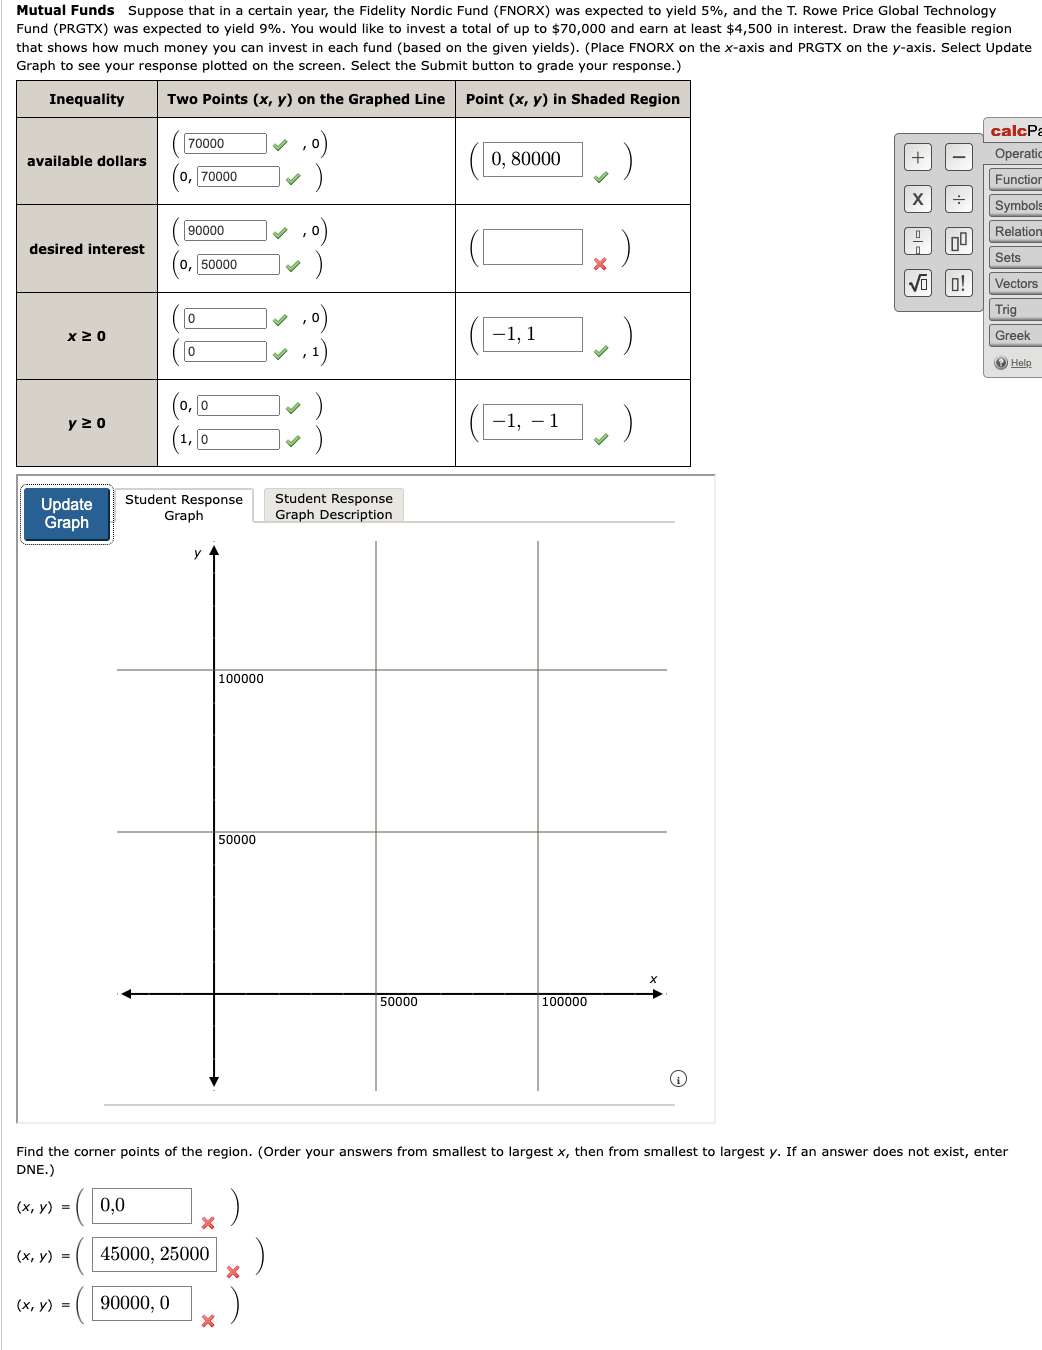
Mutual Funds Suppose that in a certain year, the Fidelity Nordic Fund (FNORX) was expected to yield 5%, and the T. Rowe Price Global Technology Fund (PRGTX) was expected to yield 9%. You would like to invest a total of up to $70,000 and earn at least $4,500 in interest. Draw the feasible region that shows how much money you can invest in each fund (based on the given yields). (Place FNORX on the x-axis and PRGTX on the y-axis. Select Update Graph to see your response plotted on the screen. Select the Submit button to grade your response.) Inequality available dollars desired interest Two Points (x, y) on the Graphed Line Point (x, y) in Shaded Region 70000 0, 70000 0, 80000 90000 0, 50000 0 0 (0,0 y≥o 0 Update Graph Student Response Graph Student Response Graph Description y 100000 50000 -1, 1 −1, − 1 x 50000 100000 calcPa + Operatio Function X Symbols 0 Relation no Sets o! Trig Vectors Greek Help Find the corner points of the region. (Order your answers from smallest to largest x, then from smallest to largest y. If an answer does not exist, enter DNE.) (x, y) = ( [ 0,0 × (x, y) 45000, 25000 (x, y) = 90000, 0
Mutual Funds Suppose that in a certain year, the Fidelity Nordic Fund (FNORX) was expected to yield 5%, and the T. Rowe Price Global Technology Fund (PRGTX) was expected to yield 9%. You would like to invest a total of up to $70,000 and earn at least $4,500 in interest. Draw the feasible region that shows how much money you can invest in each fund (based on the given yields). (Place FNORX on the x-axis and PRGTX on the y-axis. Select Update Graph to see your response plotted on the screen. Select the Submit button to grade your response.) Inequality available dollars desired interest Two Points (x, y) on the Graphed Line Point (x, y) in Shaded Region 70000 0, 70000 0, 80000 90000 0, 50000 0 0 (0,0 y≥o 0 Update Graph Student Response Graph Student Response Graph Description y 100000 50000 -1, 1 −1, − 1 x 50000 100000 calcPa + Operatio Function X Symbols 0 Relation no Sets o! Trig Vectors Greek Help Find the corner points of the region. (Order your answers from smallest to largest x, then from smallest to largest y. If an answer does not exist, enter DNE.) (x, y) = ( [ 0,0 × (x, y) 45000, 25000 (x, y) = 90000, 0

College Algebra (MindTap Course List)
12th Edition
ISBN:9781305652231
Author:R. David Gustafson, Jeff Hughes
Publisher:R. David Gustafson, Jeff Hughes
Chapter6: Linear Systems
Section6.8: Linear Programming
Problem 23E: Inventories An electronics store manager stocks from 20 to 30 IBM-compatible computers and from 30...
Question
Transcribed Image Text:Mutual Funds Suppose that in a certain year, the Fidelity Nordic Fund (FNORX) was expected to yield 5%, and the T. Rowe Price Global Technology
Fund (PRGTX) was expected to yield 9%. You would like to invest a total of up to $70,000 and earn at least $4,500 in interest. Draw the feasible region
that shows how much money you can invest in each fund (based on the given yields). (Place FNORX on the x-axis and PRGTX on the y-axis. Select Update
Graph to see your response plotted on the screen. Select the Submit button to grade your response.)
Inequality
available dollars
desired interest
Two Points (x, y) on the Graphed Line Point (x, y) in Shaded Region
70000
0, 70000
0, 80000
90000
0, 50000
0
0
(0,0
y≥o
0
Update
Graph
Student Response
Graph
Student Response
Graph Description
y
100000
50000
-1, 1
−1, − 1
x
50000
100000
calcPa
+
Operatio
Function
X
Symbols
0
Relation
no
Sets
o!
Trig
Vectors
Greek
Help
Find the corner points of the region. (Order your answers from smallest to largest x, then from smallest to largest y. If an answer does not exist, enter
DNE.)
(x, y)
= ( [ 0,0
×
(x, y)
45000, 25000
(x, y)
=
90000, 0
Expert Solution
This question has been solved!
Explore an expertly crafted, step-by-step solution for a thorough understanding of key concepts.

This is a popular solution!

Trending now
This is a popular solution!

Step by step
Solved in 2 steps with 5 images

Recommended textbooks for you
College Algebra (MindTap Course List)
Algebra
ISBN:
9781305652231
Author:
R. David Gustafson, Jeff Hughes
Publisher:
Cengage Learning
College Algebra (MindTap Course List)
Algebra
ISBN:
9781305652231
Author:
R. David Gustafson, Jeff Hughes
Publisher:
Cengage Learning