Teaching Assistant #1 Teaching Assistant #2 Professor Teaching Assistant #1 0.32 1 0.40 ased on the correlation table, the professor should arrive at which of the following conclusions? The professor and TA #2 are well calibrated, but TA #1 is off. The professor and both of his TAS are well calibrated. O The two TAs are well calibrated with each other but not with the professor. O The professor and TA #1 are well calibrated, but TA #2 is off. he professor thinks he tends to be a harsh grader and decides to multiply the grades he gave each student by 1.05 before converting the scores to cores and computing the Pearson correlation coefficient between his grades and the two teaching assistants'. This change in the professor's scores the correlation between the professor's scores and TA #1's and TA #2's scores. ill
Teaching Assistant #1 Teaching Assistant #2 Professor Teaching Assistant #1 0.32 1 0.40 ased on the correlation table, the professor should arrive at which of the following conclusions? The professor and TA #2 are well calibrated, but TA #1 is off. The professor and both of his TAS are well calibrated. O The two TAs are well calibrated with each other but not with the professor. O The professor and TA #1 are well calibrated, but TA #2 is off. he professor thinks he tends to be a harsh grader and decides to multiply the grades he gave each student by 1.05 before converting the scores to cores and computing the Pearson correlation coefficient between his grades and the two teaching assistants'. This change in the professor's scores the correlation between the professor's scores and TA #1's and TA #2's scores. ill

College Algebra
7th Edition
ISBN:9781305115545
Author:James Stewart, Lothar Redlin, Saleem Watson
Publisher:James Stewart, Lothar Redlin, Saleem Watson
Chapter1: Equations And Graphs
Section: Chapter Questions
Problem 10T: Olympic Pole Vault The graph in Figure 7 indicates that in recent years the winning Olympic men’s...

Related questions
Question
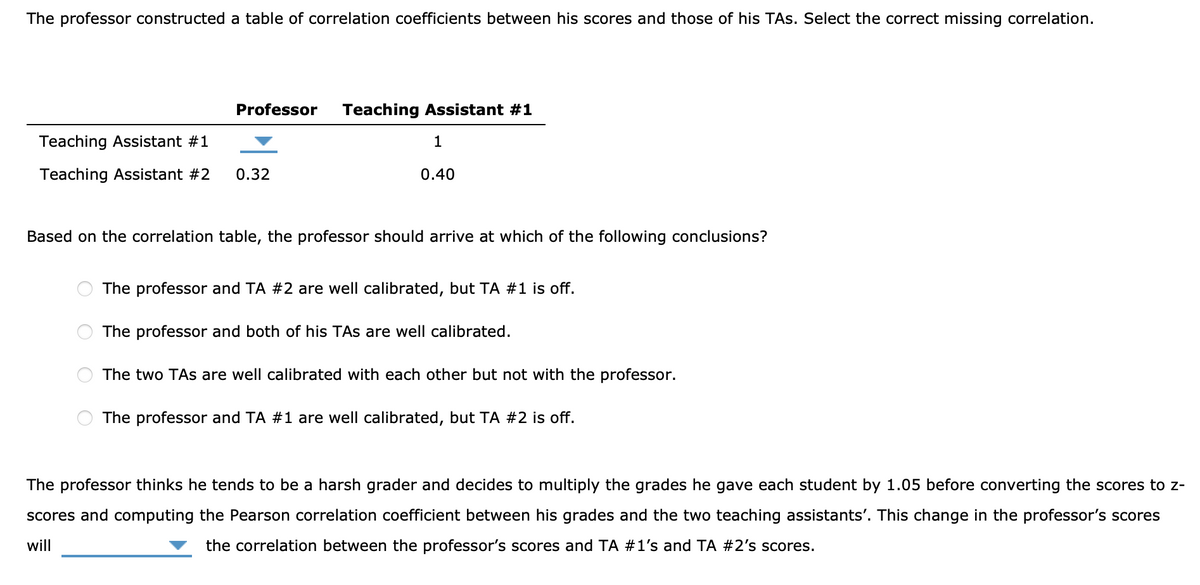
Transcribed Image Text:The professor constructed a table of correlation coefficients between his scores and those of his TAS. Select the correct missing correlation.
Teaching Assistant #1
Teaching Assistant #2
Professor Teaching Assistant #1
0.32
1
0.40
Based on the correlation table, the professor should arrive at which of the following conclusions?
The professor and TA #2 are well calibrated, but TA #1 is off.
The professor and both of his TAs are well calibrated.
The two TAs are well calibrated with each other but not with the professor.
The professor and TA #1 are well calibrated, but TA #2 is off.
The professor thinks he tends to be a harsh grader and decides to multiply the grades he gave each student by 1.05 before converting the scores to z-
scores and computing the Pearson correlation coefficient between his grades and the two teaching assistants'. This change in the professor's scores
will
the correlation between the professor's scores and TA #1's and TA #2's scores.
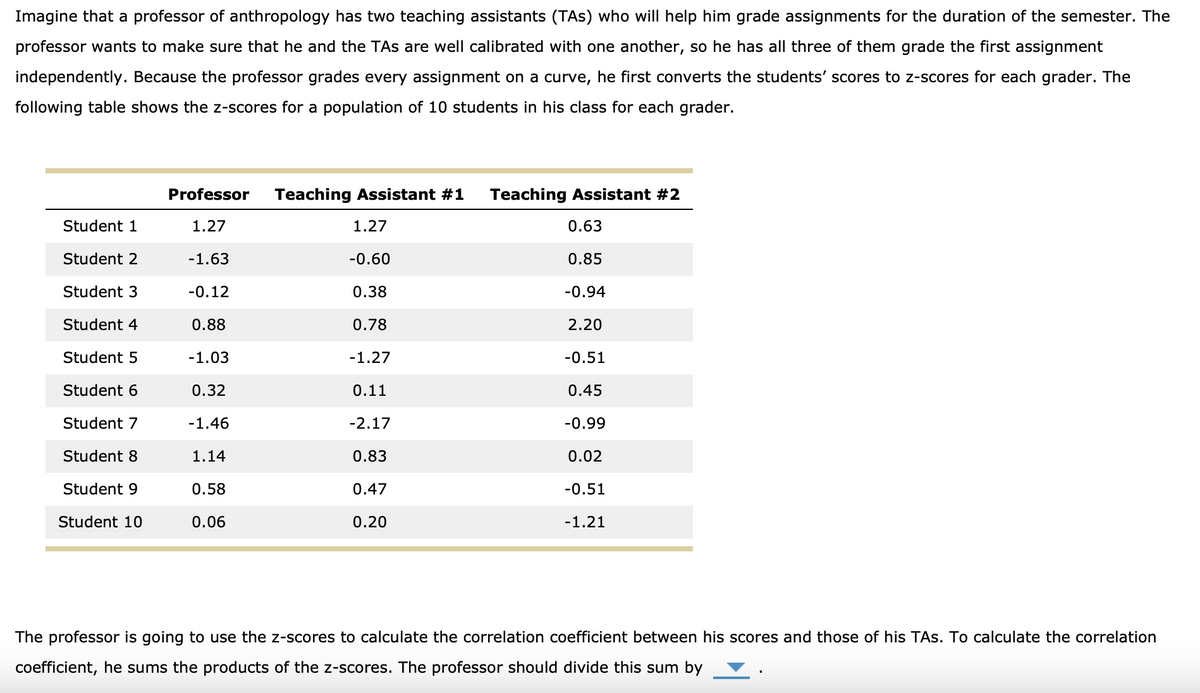
Transcribed Image Text:Imagine that a professor of anthropology has two teaching assistants (TAS) who will help him grade assignments for the duration of the semester. The
professor wants to make sure that he and the TAs are well calibrated with one another, so he has all three of them grade the first assignment
independently. Because the professor grades every assignment on a curve, he first converts the students' scores to z-scores for each grader. The
following table shows the z-scores for a population of 10 students in his class for each grader.
Student 1
Student 2
Student 3
Student 4
Student 5
Student 6
Student 7
Student 8
Student 9
Student 10
Professor
1.27
-1.63
-0.12
0.88
-1.03
0.32
-1.46
1.14
0.58
0.06
Teaching Assistant #1 Teaching Assistant #2
1.27
-0.60
0.38
0.78
-1.27
0.11
-2.17
0.83
0.47
0.20
0.63
0.85
-0.94
2.20
-0.51
0.45
-0.99
0.02
-0.51
-1.21
The professor is going to use the z-scores to calculate the correlation coefficient between his scores and those of his TAS. To calculate the correlation
coefficient, he sums the products of the z-scores. The professor should divide this sum by
Expert Solution
This question has been solved!
Explore an expertly crafted, step-by-step solution for a thorough understanding of key concepts.

This is a popular solution!

Trending now
This is a popular solution!

Step by step
Solved in 3 steps with 2 images

Recommended textbooks for you
College Algebra
Algebra
ISBN:
9781305115545
Author:
James Stewart, Lothar Redlin, Saleem Watson
Publisher:
Cengage Learning

Algebra & Trigonometry with Analytic Geometry
Algebra
ISBN:
9781133382119
Author:
Swokowski
Publisher:
Cengage

Algebra and Trigonometry (MindTap Course List)
Algebra
ISBN:
9781305071742
Author:
James Stewart, Lothar Redlin, Saleem Watson
Publisher:
Cengage Learning
College Algebra
Algebra
ISBN:
9781305115545
Author:
James Stewart, Lothar Redlin, Saleem Watson
Publisher:
Cengage Learning
Algebra & Trigonometry with Analytic Geometry
Algebra
ISBN:
9781133382119
Author:
Swokowski
Publisher:
Cengage
Algebra and Trigonometry (MindTap Course List)
Algebra
ISBN:
9781305071742
Author:
James Stewart, Lothar Redlin, Saleem Watson
Publisher:
Cengage Learning

Glencoe Algebra 1, Student Edition, 9780079039897…
Algebra
ISBN:
9780079039897
Author:
Carter
Publisher:
McGraw Hill

Functions and Change: A Modeling Approach to Coll…
Algebra
ISBN:
9781337111348
Author:
Bruce Crauder, Benny Evans, Alan Noell
Publisher:
Cengage Learning