Wetlands offer a diversity of benefits. They provide a habitat for wildlife, spawning grounds for U.S. commercial fish, and renewable timber resources. In the last 200 years, the United States has lost more than half its wetlands. Environmental Almanac gives the percentage of wetlands lost in each state in the last 200 years. For the 30 of the lower 48 states, the percentage loss of wetlands per state is as follows. 33 48 42 30 38 60 71 51 51 20 83 90 87 35 50 45 37 45 59 9 38 9 38 24 89 68 27 50 50 55 42 35 Make a stem-and-leaf display of these data. (Use the tens digit as the stem and the ones digit as the leaf. Enter NONE in any unused answer blanks.) Percent of Wetlands Lost How are the percentages distributed? Is the distribution skewed? Are there any gaps? (Select all that apply.) These data are fairly symmetric, perhaps slightly skewed right. These data are strongly skewed left. There is a gap showing that none of the lower 48 states has lost from 10% to 19% of its wetlands. There is a gap showing that none of the lower 48 states has lost from 60% to 69% of its wetlands. There are no gaps in the data. The percentages are concentrated from 60% to 90%. The percentages are concentrated from 20% to 60%.
Wetlands offer a diversity of benefits. They provide a habitat for wildlife, spawning grounds for U.S. commercial fish, and renewable timber resources. In the last 200 years, the United States has lost more than half its wetlands. Environmental Almanac gives the percentage of wetlands lost in each state in the last 200 years. For the 30 of the lower 48 states, the percentage loss of wetlands per state is as follows. 33 48 42 30 38 60 71 51 51 20 83 90 87 35 50 45 37 45 59 9 38 9 38 24 89 68 27 50 50 55 42 35 Make a stem-and-leaf display of these data. (Use the tens digit as the stem and the ones digit as the leaf. Enter NONE in any unused answer blanks.) Percent of Wetlands Lost How are the percentages distributed? Is the distribution skewed? Are there any gaps? (Select all that apply.) These data are fairly symmetric, perhaps slightly skewed right. These data are strongly skewed left. There is a gap showing that none of the lower 48 states has lost from 10% to 19% of its wetlands. There is a gap showing that none of the lower 48 states has lost from 60% to 69% of its wetlands. There are no gaps in the data. The percentages are concentrated from 60% to 90%. The percentages are concentrated from 20% to 60%.

Holt Mcdougal Larson Pre-algebra: Student Edition 2012
1st Edition
ISBN:9780547587776
Author:HOLT MCDOUGAL
Publisher:HOLT MCDOUGAL
Chapter7: Percents
Section7.5: Percent Of Change
Problem 22E

Related questions
Question
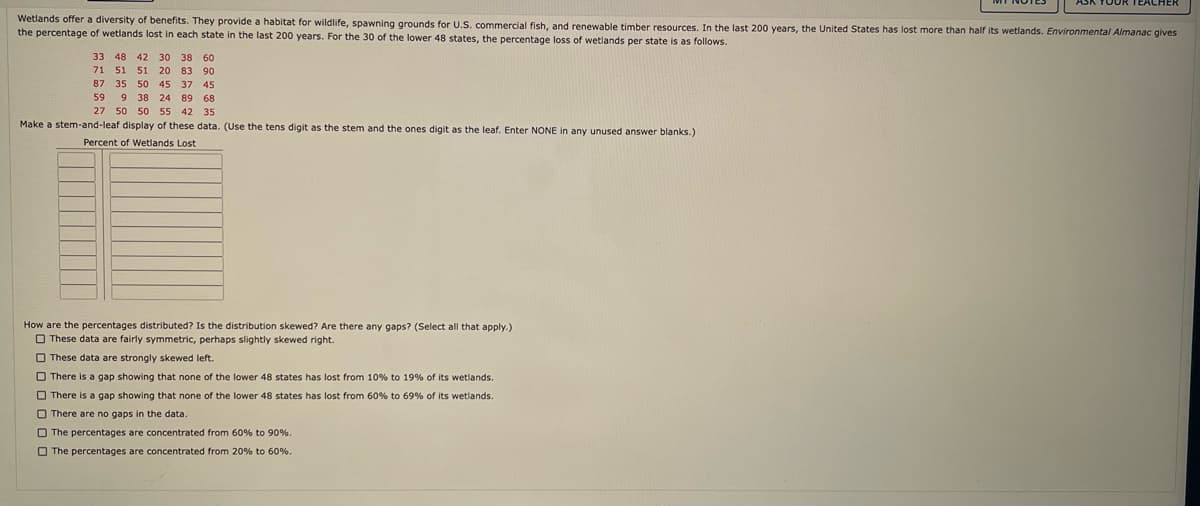
Transcribed Image Text:Wetlands offer a diversity of benefits. They provide a habitat for wildlife, spawning grounds for U.S. commercial fish, and renewable timber resources. In the last 200 years, the United States has lost more than half its wetlands. Environmental Almanac gives
the percentage of wetlands lost in each state in the last 200 years. For the 30 of the lower 48 states, the percentage loss of wetlands per state is as follows.
33 48 42
30 38 60
71 51
51 51
51
20 83 90
87 35 50
45 37 45
59 9 38 24 89 68
27 50 50 55 42 35
Make a stem-and-leaf display of these data. (Use the tens digit as the stem and the ones digit as the leaf. Enter NONE in any unused answer blanks.)
Percent of Wetlands Lost
How are the percentages distributed? Is the distribution skewed? Are there any gaps? (Select all that apply.)
These data are fairly symmetric, perhaps slightly skewed right.
These data are strongly skewed left.
There is a gap showing that none of the lower 48 states has lost from 10% to 19% of its wetlands.
There is a gap showing that none of the lower 48 states has lost from 60% to 69% of its wetlands.
There are no gaps in the data.
The percentages are concentrated from 60% to 90%.
The percentages are concentrated from 20% to 60%.
Expert Solution
This question has been solved!
Explore an expertly crafted, step-by-step solution for a thorough understanding of key concepts.

This is a popular solution!

Trending now
This is a popular solution!

Step by step
Solved in 3 steps

Recommended textbooks for you
Holt Mcdougal Larson Pre-algebra: Student Edition…
Algebra
ISBN:
9780547587776
Author:
HOLT MCDOUGAL
Publisher:
HOLT MCDOUGAL

Linear Algebra: A Modern Introduction
Algebra
ISBN:
9781285463247
Author:
David Poole
Publisher:
Cengage Learning

Glencoe Algebra 1, Student Edition, 9780079039897…
Algebra
ISBN:
9780079039897
Author:
Carter
Publisher:
McGraw Hill
Holt Mcdougal Larson Pre-algebra: Student Edition…
Algebra
ISBN:
9780547587776
Author:
HOLT MCDOUGAL
Publisher:
HOLT MCDOUGAL
Linear Algebra: A Modern Introduction
Algebra
ISBN:
9781285463247
Author:
David Poole
Publisher:
Cengage Learning
Glencoe Algebra 1, Student Edition, 9780079039897…
Algebra
ISBN:
9780079039897
Author:
Carter
Publisher:
McGraw Hill

Algebra & Trigonometry with Analytic Geometry
Algebra
ISBN:
9781133382119
Author:
Swokowski
Publisher:
Cengage

Big Ideas Math A Bridge To Success Algebra 1: Stu…
Algebra
ISBN:
9781680331141
Author:
HOUGHTON MIFFLIN HARCOURT
Publisher:
Houghton Mifflin Harcourt