
APPLIED STAT.IN BUS.+ECONOMICS
6th Edition
ISBN: 9781259957598
Author: DOANE
Publisher: RENT MCG
expand_more
expand_more
format_list_bulleted
Videos
Textbook Question
Chapter 14.2, Problem 2SE
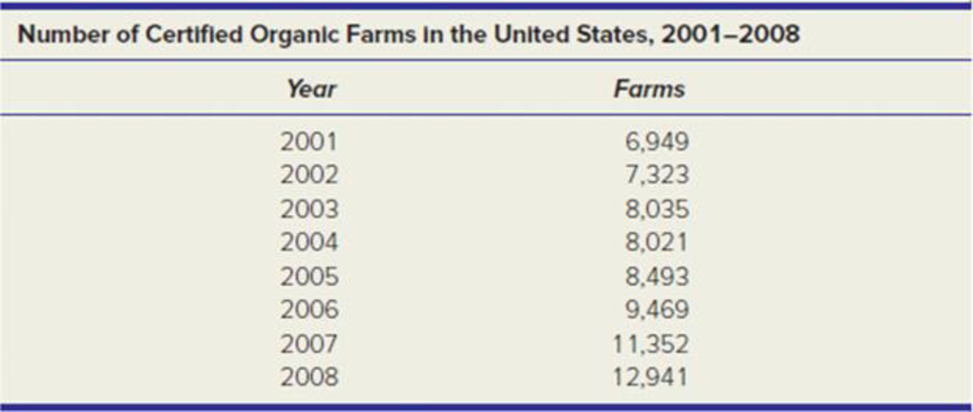
(a) Make an Excel graph of the data on the number of certified organic farms in the United States. (b) Discuss the underlying causes that might explain the trend or pattern. (c) Fit three trends (linear, quadratic, exponential) to the time series. (d) Which trend model do you think is best to make forecasts for the next three years? Why? (e) Use each of the three fitted trend equations to make numerical forecasts for the next three years. How similar are the three models’ forecasts?
Source: www.faa.gov.
Expert Solution & Answer
Want to see the full answer?
Check out a sample textbook solution
Students have asked these similar questions
Cryptocurrencies have rapidly become an important alternative to traditional currencies for many types of transactions. Etherium, one of the most prominent cryptocurrencies, has rapidly appreciated in value. Daily Etherium trading information for the first 332 days of 2021.
It includes the following variables:
Date
Day – Day of the year, used to assess trend over time
Volume (US $) – Daily trading volume
Opening Price (US $) – Opening price for daily trading
Price Change (US $) – Daily change in price from opening to close
1. Determine the sample correlation coefficient, r, between Volume and Price Change. Test the alternative hypothesis that Volume has a linear relationship to Price Change. Specifically, what are the test statistic and the p-value for that test statistic? For α = .05, what do you conclude about the relationship between the variables? (reminder: the T.DIST.2T function requires input of a positive test statistic)
What do the Forecast for each year add up to?
Examine the data for each race/ethnicity group. Do the data represent a stationary or nonstationary process?
Do any of the race/ethnicity groups exhibit a decreasing trend?
Do any of the race/ethnicity groups show a strictly increasing trend over the entire time period from 2000 to 2016?
Chapter 14 Solutions
APPLIED STAT.IN BUS.+ECONOMICS
Ch. 14.2 - (a) Make an Excel graph of the data on the number...Ch. 14.2 - Prob. 3SECh. 14.2 - Prob. 4SECh. 14.2 - Prob. 5SECh. 14.4 - (a) Make an Excel line graph of the exchange rate...Ch. 14.5 - (a) Make an Excel line graph of the following bond...Ch. 14 - Explain the difference between (a) stocks and...Ch. 14 - (a) What is periodicity? (b) Give original...Ch. 14 - (a) What are the distinguishing features of each...Ch. 14 - Name four criteria for assessing a trend forecast.
Ch. 14 - Name two advantages and two disadvantages of each...Ch. 14 - When would the exponential trend model be...Ch. 14 - Explain how to obtain the compound percent growth...Ch. 14 - (a) When might a quadratic model be useful? (b)...Ch. 14 - Name five measures of fit for a trend, and state...Ch. 14 - Prob. 10CRCh. 14 - Prob. 11CRCh. 14 - Prob. 12CRCh. 14 - (a) Why is seasonality irrelevant for annual data?...Ch. 14 - Prob. 14CRCh. 14 - (a) Explain how seasonal binaries can be used to...Ch. 14 - What is the purpose of index numbers?Ch. 14 - (a) Make a line chart for JetBlues revenue. (b)...Ch. 14 - (a) Plot both Swiss watch time series on the same...Ch. 14 - (a) Make a line graph of the U.S. civilian labor...Ch. 14 - (a) Plot the voter participation rate. (b)...Ch. 14 - For each of the following fitted trends, make a...Ch. 14 - (a) Make a line graph of consumer credit...Ch. 14 - (a) Plot the data on U.S. general aviation...Ch. 14 - Prob. 17CECh. 14 - (a) Plot either receipts and outlays or federal...Ch. 14 - Prob. 19CECh. 14 - (a) Plot the data on leisure and hospitality...Ch. 14 - Prob. 21CECh. 14 - Prob. 22CECh. 14 - (a) Plot the data on skier/snowboard visits. (b)...Ch. 14 - Prob. 24CECh. 14 - (a) Plot U.S. petroleum imports on a graph. (b)...Ch. 14 - (a) Make a line chart and fit an m-period moving...Ch. 14 - Refer to exercise 14.26. (a) Plot the dollar/pound...Ch. 14 - (a) Plot the data on natural gas bills. (b) Can...Ch. 14 - (a) Plot the data on air travel delays. (b) Can...Ch. 14 - (a) Plot the data on airplane shipments. (b) Can...Ch. 14 - (a) Plot the data on revolving credit (credit...Ch. 14 - The following seasonal regression was fitted with...Ch. 14 - The following seasonal regression was fitted with...
Knowledge Booster


Learn more about
Need a deep-dive on the concept behind this application? Look no further. Learn more about this topic, statistics and related others by exploring similar questions and additional content below.Similar questions
- The US. import of wine (in hectoliters) for several years is given in Table 5. Determine whether the trend appearslinear. Ifso, and assuming the trend continues, in what year will imports exceed 12,000 hectoliters?arrow_forwardThe U.S. Census tracks the percentage of persons 25 years or older who are college graduates. That data forseveral years is given in Table 4[14]. Determine whether the trend appears linear. If so, and assuming the trendcontinues. in what year will the percentage exceed 35%?arrow_forwardStock Market The week of September 15, 2008 was one of the most volatile weeks ever for the US stock market. The closing numbers of the Dow Jones Industrial Average each day were: What was the overall change for the week? Was it positive or negative?arrow_forward
- 100% 89.6% 90% 84.1% Seat belt use rate 80% 70% 60% 50% 43.6% 38.5% 40% Percent of unrestrained passenger vehicle occupant fatalities 30% 20% 2009 2010 2011 2012 2013 2014 2015 2016 2017 2018 Expand each part and complete the questions. O Part 1 - Trends Related to Seatbelt Use Complete the sentence to correctly summarize the trends that can be observed in the chart. Between 2009 and 2018, the rate of seatbelt use ---Select--- v and the percentage of unrestrained vehicle fatalities --Select--- O Part 2 - Percent of Unrestrained Passenger Vehicle Fatalities Calculate the absolute and percentage change in the percent of unrestrained passenger vehicle fataliti Include appropriate units. Write a sentence to interpret each result. Absolute change (Do not round): ---Select--- Between 2009 and 2018, the percent of unrestrained passenger vehicle fatalities ---Select--- |by ---Select--- Percentage change (Round to one decimal place): ---Select--- Between the 2009 and 2018, the percent of…arrow_forwardEloise needs to finish a 516-page report on international trade so she can present it at the big conference this weekend. She's been tracking her page count at the end of each business day to see if she's on track. Use Excel to fit a trendline to Eloise's data to create a model of her productivity. According to your model, will Eloise be able to finish her report by the end of the day next Friday? Assume she works only on weekdays. Day Pages Monday 425 Tuesday 431 Wednesday 449 Thursday 464 Friday 471 A: Use Excel to fit a trendline to Eloise's data. What are the slope and intercept for this line? The slope is The intercept is B: Use your model (trendline) to answer the question. Will Eloise finish her report by the end of next friday? Yesarrow_forwardThe median home value in Michigan and Massachusetts (adjusted for inflation) are shown below: Year Michigan Massachusetts 1950 45400 55400 2000 115600 185700 If we assume that the house values are changing linearly,In which state have home values increased at a higher rate? MassachusettsIf these trends were to continue, what would be the median home value in Michigan in 2010?$129640If we assume the linear trend existed before 1950 and continues after 2000, the two states' median house values will be (or were) equal in what year? (The answer might be absurd)The year ______arrow_forward
arrow_back_ios
arrow_forward_ios
Recommended textbooks for you
 Calculus For The Life SciencesCalculusISBN:9780321964038Author:GREENWELL, Raymond N., RITCHEY, Nathan P., Lial, Margaret L.Publisher:Pearson Addison Wesley,
 Elementary AlgebraAlgebraISBN:9780998625713Author:Lynn Marecek, MaryAnne Anthony-SmithPublisher:OpenStax - Rice University
 Glencoe Algebra 1, Student Edition, 9780079039897...AlgebraISBN:9780079039897Author:CarterPublisher:McGraw Hill
 Algebra & Trigonometry with Analytic GeometryAlgebraISBN:9781133382119Author:SwokowskiPublisher:Cengage
Calculus For The Life Sciences
Calculus
ISBN:9780321964038
Author:GREENWELL, Raymond N., RITCHEY, Nathan P., Lial, Margaret L.
Publisher:Pearson Addison Wesley,
Elementary Algebra
Algebra
ISBN:9780998625713
Author:Lynn Marecek, MaryAnne Anthony-Smith
Publisher:OpenStax - Rice University
Glencoe Algebra 1, Student Edition, 9780079039897...
Algebra
ISBN:9780079039897
Author:Carter
Publisher:McGraw Hill
Algebra & Trigonometry with Analytic Geometry
Algebra
ISBN:9781133382119
Author:Swokowski
Publisher:Cengage
Time Series Analysis Theory & Uni-variate Forecasting Techniques; Author: Analytics University;https://www.youtube.com/watch?v=_X5q9FYLGxM;License: Standard YouTube License, CC-BY
Operations management 101: Time-series, forecasting introduction; Author: Brandoz Foltz;https://www.youtube.com/watch?v=EaqZP36ool8;License: Standard YouTube License, CC-BY