
APPLIED STAT.IN BUS.+ECONOMICS
6th Edition
ISBN: 9781259957598
Author: DOANE
Publisher: RENT MCG
expand_more
expand_more
format_list_bulleted
Videos
Textbook Question
Chapter 16.6, Problem 11SE
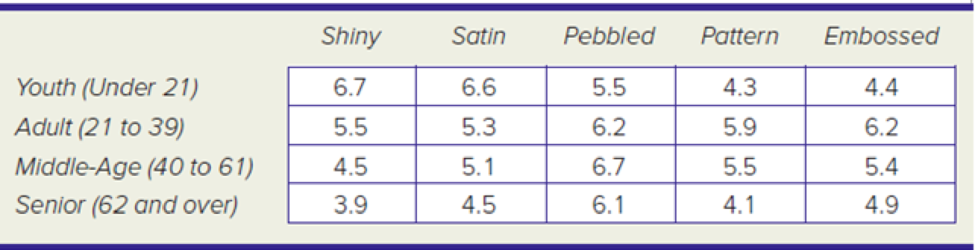
Consumers are asked to rate the attractiveness of four potential dashboard surface textures on an interval scale (1 = least attractive, 10 = most attractive). Use MegaStat or another software package to perform a Friedman test to see whether the median ratings of surfaces differ at α = .05, using age as the blocking factor.
Expert Solution & Answer
Want to see the full answer?
Check out a sample textbook solution
Students have asked these similar questions
Determine the type of variation model that best fits the data in the attached image.
Find the semi-interquartile range of the data set whose box plot is given below.
Construct a box plot from the given data use the approximation method
Chapter 16 Solutions
APPLIED STAT.IN BUS.+ECONOMICS
Ch. 16.2 - Prob. 1SECh. 16.2 - Prob. 2SECh. 16.2 - Prob. 3SECh. 16.2 - Prob. 4SECh. 16.3 - A sample of 28 student scores on the chemistry...Ch. 16.3 - Prob. 6SECh. 16.4 - Prob. 7SECh. 16.4 - Prob. 8SECh. 16.5 - Prob. 9SECh. 16.5 - The results shown below are mean productivity...
Ch. 16.6 - Consumers are asked to rate the attractiveness of...Ch. 16.6 - Prob. 12SECh. 16.7 - Prob. 13SECh. 16.7 - Prob. 14SECh. 16 - Prob. 1CRCh. 16 - Prob. 2CRCh. 16 - Prob. 3CRCh. 16 - Prob. 4CRCh. 16 - Prob. 5CRCh. 16 - Prob. 6CRCh. 16 - Prob. 7CRCh. 16 - Prob. 8CRCh. 16 - Prob. 9CRCh. 16 - Prob. 10CRCh. 16 - (a) Why is a significant correlation not proof of...Ch. 16 - Prob. 15CECh. 16 - Prob. 16CECh. 16 - Prob. 17CECh. 16 - Prob. 18CECh. 16 - Prob. 19CECh. 16 - Instructions: In all exercises, you may use a...Ch. 16 - Prob. 21CECh. 16 - Prob. 22CECh. 16 - Prob. 23CECh. 16 - Prob. 24CECh. 16 - Prob. 25CECh. 16 - Instructions: In all exercises, you may use a...Ch. 16 - Prob. 27CECh. 16 - Instructions: In all exercises, you may use a...Ch. 16 - Prob. 29CECh. 16 - Prob. 30CECh. 16 - Prob. 31CECh. 16 - Prob. 32CECh. 16 - Prob. 33CECh. 16 - Prob. 34CECh. 16 - Instructions: In all exercises, you may use a...Ch. 16 - Prob. 36CECh. 16 - Prob. 37CE
Knowledge Booster


Learn more about
Need a deep-dive on the concept behind this application? Look no further. Learn more about this topic, statistics and related others by exploring similar questions and additional content below.Similar questions
- Tire pressure (psi) and mileage (mpg) were recorded for a random sample of seven cars of thesame make and model. The extended data table (left) and fit model report (right) are based on aquadratic model. Calculate R2. Describe what this value means in the context of the problem.arrow_forwardWhat type of function would describe a curve that best fits the data based on the scatter plot shown?arrow_forwardwhat is ther interquartile range of the data shown in the box plot above?arrow_forward
- Given the raw data, create a box plot that would show central tendency and variability of data in each set. Provide a brief desciption of the box plot describing its results.arrow_forwardPlot the data without using a box plot. Is there an association in these data between female type and fertilizations by AA sperm?arrow_forwardThe manager of a certain bank has recorded the amount of time, recorded to thenearest tenth of a minute, a sample of customers spent waiting in line during peakbusiness hours on a Monday in two of the bank’s branches (one located in the centralbusiness district while the other located in the suburb). REQUIRED: Using RStudio, Create a box plot for each of the two data sets. Compare the plots. What are yourobservations? Please also provide the rscript thank you!arrow_forward
- Choose a coefficient of determination that matches the scatter plot. Assume that the scales on the horizontal and vertical axes are the samearrow_forwardCalculate the effect size of the data below?arrow_forwardThe attached data contains Part Quality data of three suppliers. At = 0.05, does Part Quality depend on Supplier, or should the cheapest Supplier be chosen?arrow_forward
- Identify the feature of the data that would be missed if part (b) was completed without constructing the scatterplot. Choose the correct answer below.arrow_forwardA consumers group recently tested 100 compact fluorescent light bulbs and recorded their lifetimes. The chart shows the results Determine the median, range, first and third quartiles, and interquartile range. Create a whisker plot of the dataarrow_forwardSuppose a researcher collects data on the bacterial contamination, measured in colony-forming unit per milliliter, for both upstream and downstream sections of 35 rivers. The data is plotted with upstream bacterial contamination on the horizontal axis and downstream bacterial contamination on the vertical axis. The Scioto River is an outlier in the ?y‑direction. What must be true about this river? The upstream bacterial contamination for this river is much higher or lower than the rest of the rivers in the data set. The downstream bacterial contamination for this river is much higher or lower than other rivers in the data set that have similar upstream bacterial contamination. This river is an influential observation. The downstream bacterial contamination for this river is much higher or much lower than the rest of the rivers in the data set. The absolute value of the residual of this river is large.arrow_forward
arrow_back_ios
SEE MORE QUESTIONS
arrow_forward_ios
Recommended textbooks for you
 Glencoe Algebra 1, Student Edition, 9780079039897...AlgebraISBN:9780079039897Author:CarterPublisher:McGraw Hill
 Holt Mcdougal Larson Pre-algebra: Student Edition...AlgebraISBN:9780547587776Author:HOLT MCDOUGALPublisher:HOLT MCDOUGAL
 Big Ideas Math A Bridge To Success Algebra 1: Stu...AlgebraISBN:9781680331141Author:HOUGHTON MIFFLIN HARCOURTPublisher:Houghton Mifflin Harcourt
Glencoe Algebra 1, Student Edition, 9780079039897...
Algebra
ISBN:9780079039897
Author:Carter
Publisher:McGraw Hill
Holt Mcdougal Larson Pre-algebra: Student Edition...
Algebra
ISBN:9780547587776
Author:HOLT MCDOUGAL
Publisher:HOLT MCDOUGAL
Big Ideas Math A Bridge To Success Algebra 1: Stu...
Algebra
ISBN:9781680331141
Author:HOUGHTON MIFFLIN HARCOURT
Publisher:Houghton Mifflin Harcourt
Hypothesis Testing using Confidence Interval Approach; Author: BUM2413 Applied Statistics UMP;https://www.youtube.com/watch?v=Hq1l3e9pLyY;License: Standard YouTube License, CC-BY
Hypothesis Testing - Difference of Two Means - Student's -Distribution & Normal Distribution; Author: The Organic Chemistry Tutor;https://www.youtube.com/watch?v=UcZwyzwWU7o;License: Standard Youtube License