
Concept explainers
Videos
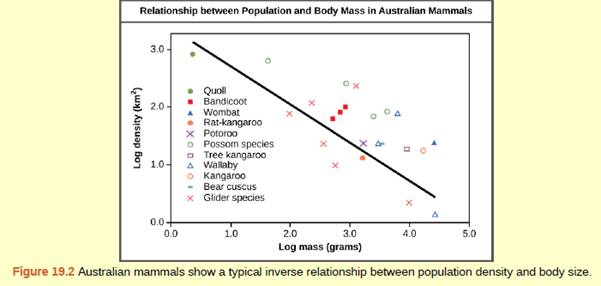
Figure 19.2 As this graph shows, population density typically decreases with increasing body size. Why do you think this is the case?
To write:
The population density depending upon the body size of the organisms.
Introduction:
Populations are dynamic entities. In response to various factors, their size and composition change, including seasonal and annual changes in the environment, natural disasters such as volcanic eruptions, forest fires, and competition between or within species for resources.
Explanation of Solution
The graph depicts a density-dependent population. Populations are identified by population size and population density. A population can have a large number of people densely or sparsely distributed. There are also populations with small amounts of individuals that can be dense or very slightly distributed in a local area. Population size may affect the adaptation potential as it affects the number of genetic variation in the population. Density can affect interactions in a population such as food competition and individuals ' ability to find a partner. Smaller individuals are more densely distributed than larger individuals.
Thus, the size of the body is regulating the density of the population. The population with smaller body size shows more density than those which have a larger body size.
Want to see more full solutions like this?
Chapter 19 Solutions
Concepts of Biology
Additional Science Textbook Solutions
College Physics
Microbiology with Diseases by Body System (4th Edition)
Concepts of Genetics (12th Edition)
Human Anatomy & Physiology (2nd Edition)
Campbell Essential Biology with Physiology (6th Edition)
Microbiology: An Introduction


- A population of Giant armadillo, an endangered species found in South America, increased in numbers from 152 to 174 from 2001 to 2006. The per capita growth rate for the armadillo population is ? (three decimal places)arrow_forwardThe world population reached seven billion in 2011. At current growth rate, it is expected to reach eight billion by 2024 and nine billion by 2037. However, many projections predict that the world population will level off at around 9 billion individuals. Why is the world population expected to level off?arrow_forwardIf a population has a constant r = 0.3 Group of answer choices the per capita rate of population increase continues to accelerate as the population grows the time necessary for population size to double gets shorter as time goes by since population size is increasing exponentially the absolute increase (change in population size per unit time) is also constant the time necessary for population size to double is also constantarrow_forward
- Given the following figure of logistic growth, Logistic Growth D A Time when the population reaches point C on the figure, we can conclude that: birth rate is greater than death rate the population has surpassed carrying capacity death rate is equal to birth rate death rate is greater than birth rate Population sizearrow_forwardBy now, you must have already learned a lot about POPULATION DYNAMICS. How will you know that the population size increased/decreased? What are the indicators for the increase/decrease? What factors are known to be responsible for the increase/decrease? Give as many as you can think of.arrow_forwardWhat do you mean by population density?arrow_forward
- several years ago wolves were reintroduced in to a national park in North Carolina. Researchers have monitored the populations over the last several years and the per capita growth rate of the population is.5. If the current population size is 100, what equation would you use to determine how large he population will be in ten yearS? N/t *r N(1+r)^t (N*r)/t please highlight the answerarrow_forwardFigure 19.11 Age structure diagrams for rapidly growing, slow growing, and stable populations are shown in stages 1 through 3. What type of population change do you think stage 4 represents?arrow_forwardAccording to Worldometers, in late November, 2018, the U.S. population was 327,726,061 and the world population was estimated at 7,666,602,725. Considering those numbers, do you think the United States is in a population crisis? Do we have enough land and resources to support a continuous increase in population? Should we, as a nation, concentrate on controlling our population or controlling resource use? Why, or why not?arrow_forward
- Figure (c) shows a population increasing in size under the influence of the relationships in (a) and (b). What do each arrow represent?arrow_forwardSeveral years ago wolves were reintroduced in to a national park in North Carolina. Researchers have monitored the populations over the last several years and the per capita growth rate of the population is .5. If the current population size is 100, what equation would you use to determine how large the population will be in ten years? O N(1+r)* N/t *r O (N*r)/tarrow_forwardIn which of the following situations is exponential growth of a population common? For each of the following, select yes if is common and no if it not common. 1. A population is devastated by a natural disaster and begins to recover [ Select ] 2. A population is highly density dependent [ Select ] 3. A few individuals found a new population in a new habitat with no natural predators [ Select ] 4. A population that has fewer births with increasing population size [ Select ]arrow_forward
 Concepts of BiologyBiologyISBN:9781938168116Author:Samantha Fowler, Rebecca Roush, James WisePublisher:OpenStax College
 Biology 2eBiologyISBN:9781947172517Author:Matthew Douglas, Jung Choi, Mary Ann ClarkPublisher:OpenStax
 Biology Today and Tomorrow without Physiology (Mi...BiologyISBN:9781305117396Author:Cecie Starr, Christine Evers, Lisa StarrPublisher:Cengage Learning