
STATISTICS F/BUSINESS+ECONOMICS-TEXT
13th Edition
ISBN: 9781305881884
Author: Anderson
Publisher: CENGAGE L
expand_more
expand_more
format_list_bulleted
Concept explainers
Videos
Textbook Question
Chapter 20.2, Problem 1E
The following table reports prices and usage quantities for two items in 2009 and 2011.
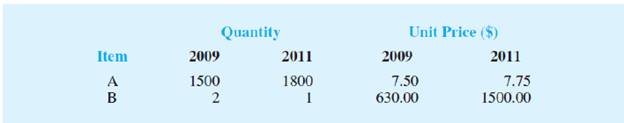
- a. Compute price relatives for each item in 2011 using 2009 as the base period.
- b. Compute an unweighted aggregate price index for the two items in 2011 using 2009 as the base period.
- c. Compute a weighted aggregate price index for the two items using the Laspeyres method.
- d. Compute a weighted aggregate price index for the two items using the Paasche method.
Expert Solution & Answer

Trending nowThis is a popular solution!

Students have asked these similar questions
Use the following price information for selected items for 2010 and 2018. Production figures for those two periods are also given.
Use the following price information for selected foods for 2000 and 2013 given in the following table in the image.
a. Compute a simple price index for each of the four items. Use 2000 as the base period.
b. Compute a simple aggregate price index. Use 2000 as the base period.
c.Compute Laspeyres’ price index for 2013 using 2000 as the base period.
Use the following price information for selected items for 2010 and 2018. Production figures for those two periods are also given.
Compute a simple price index for each of the four items. Use 2010 as the base period. (Round your answers to 1 decimal place.)
Chapter 20 Solutions
STATISTICS F/BUSINESS+ECONOMICS-TEXT
Ch. 20.2 - The following table reports prices and usage...Ch. 20.2 - An item with a price relative of 132 cost 10.75 in...Ch. 20.2 - A large manufacturer purchases an identical...Ch. 20.2 - Prob. 4ECh. 20.2 - Under the last-in, first-out (LIFO) inventory...Ch. 20.3 - Price relatives for three items, along with...Ch. 20.3 - The Mitchell Chemical Company produces a special...Ch. 20.3 - Prob. 8ECh. 20.3 - Compute the price relatives for the RB Beverages...Ch. 20.5 - Registered nurses in 2007 made an average hourly...
Ch. 20.5 - The average hourly wage rate for construction...Ch. 20.5 - Shipments of product from manufacturer to the...Ch. 20.5 - The revenue for Google for the years 2010-2014 is...Ch. 20.7 - Data on quantities of three items sold in Year 1...Ch. 20.7 - Prob. 15ECh. 20.7 - Prob. 16ECh. 20 - Many factors influence the retail price of...Ch. 20 - Nickerson Manufacturing Company has the following...Ch. 20 - Prob. 19ECh. 20 - Prob. 20ECh. 20 - Prob. 21ECh. 20 - Prob. 22ECh. 20 - Seafood price and quantity data are reported by...Ch. 20 - Prob. 24ECh. 20 - Prob. 25ECh. 20 - Prob. 26E
Knowledge Booster


Learn more about
Need a deep-dive on the concept behind this application? Look no further. Learn more about this topic, statistics and related others by exploring similar questions and additional content below.Similar questions
- 6. An item has a new selling price of P200.00 and markdown of P30.00. Find its original selling price, and markdown rate based on original selling price.arrow_forwardUse the following price information for selected items for 2010 and 2018. Production figures for those two periods are also given. Price Quantity Item 2010 2018 2010 2018 Aluminum (cents per pound) $ 0.82 $ 0.86 1,000 1,200 Natural gas $ per million BLA 4.37 2.99 5,000 4,000 Petroleum (barrel) 71.21 58.15 60,000 60,000 Platinum (troy ounce) 1,743.60 1,292.53 500 600 Determine Fisher's ideal index for 2018 using 2010 as the base period. (Round your answer to 2 decimal places.)arrow_forwardUse the following price information for selected items for 2010 and 2018. Production figures for those two periods are also given. Price Quantity Item 2010 2018 2010 2018 Aluminum (cents per pound) $ 0.82 $ 0.86 1,000 1,200 Natural gas $ per million BLA 4.37 2.99 5,000 4,000 Petroleum (barrel) 71.21 58.15 60,000 60,000 Platinum (troy ounce) 1,743.60 1,292.53 500 600arrow_forward
Recommended textbooks for you
 MATLAB: An Introduction with ApplicationsStatisticsISBN:9781119256830Author:Amos GilatPublisher:John Wiley & Sons Inc
 Probability and Statistics for Engineering and th...StatisticsISBN:9781305251809Author:Jay L. DevorePublisher:Cengage Learning
 Statistics for The Behavioral Sciences (MindTap C...StatisticsISBN:9781305504912Author:Frederick J Gravetter, Larry B. WallnauPublisher:Cengage Learning
 Elementary Statistics: Picturing the World (7th E...StatisticsISBN:9780134683416Author:Ron Larson, Betsy FarberPublisher:PEARSON
 The Basic Practice of StatisticsStatisticsISBN:9781319042578Author:David S. Moore, William I. Notz, Michael A. FlignerPublisher:W. H. Freeman
 Introduction to the Practice of StatisticsStatisticsISBN:9781319013387Author:David S. Moore, George P. McCabe, Bruce A. CraigPublisher:W. H. Freeman
MATLAB: An Introduction with Applications
Statistics
ISBN:9781119256830
Author:Amos Gilat
Publisher:John Wiley & Sons Inc
Probability and Statistics for Engineering and th...
Statistics
ISBN:9781305251809
Author:Jay L. Devore
Publisher:Cengage Learning
Statistics for The Behavioral Sciences (MindTap C...
Statistics
ISBN:9781305504912
Author:Frederick J Gravetter, Larry B. Wallnau
Publisher:Cengage Learning
Elementary Statistics: Picturing the World (7th E...
Statistics
ISBN:9780134683416
Author:Ron Larson, Betsy Farber
Publisher:PEARSON
The Basic Practice of Statistics
Statistics
ISBN:9781319042578
Author:David S. Moore, William I. Notz, Michael A. Fligner
Publisher:W. H. Freeman
Introduction to the Practice of Statistics
Statistics
ISBN:9781319013387
Author:David S. Moore, George P. McCabe, Bruce A. Craig
Publisher:W. H. Freeman
Correlation Vs Regression: Difference Between them with definition & Comparison Chart; Author: Key Differences;https://www.youtube.com/watch?v=Ou2QGSJVd0U;License: Standard YouTube License, CC-BY
Correlation and Regression: Concepts with Illustrative examples; Author: LEARN & APPLY : Lean and Six Sigma;https://www.youtube.com/watch?v=xTpHD5WLuoA;License: Standard YouTube License, CC-BY