
Concept explainers
Videos
For Exercises 1–2, indicate all critical points on the given graphs. Which correspond to
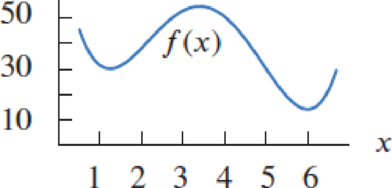
To indicate: All critical points on the given graphs, which correspond to local maxima, local minima, global maxima, global minima or none of these.
Explanation of Solution
Definition used:
Local maxima and local minima:
Suppose p is a point in the domain of f(x):
1. f(x) has a local minimum at p if f(p) is less than or equal to the values of f(x) for points near p.
2. f(x) has a local maximum at p if f(p) is greater than or equal to the values of f(x) for points near p.
Global maxima and minima:
Suppose p is a point in the domain of f(x):
1. f(x) has a global minimum at p if f(p) is less than or equal to all values of f(x).
2. f(x) has a global maximum at p if f(p) is greater than or equal to all values of f(x).
Theorem used:
If f is continuous on the closed interval
Calculation:
It is given that, the graph is on closed interval, by the above theorem the function will have global maximum and a global minimum on the interval.
Redraw the graphs marking the critical points as shown below in Figure 1.
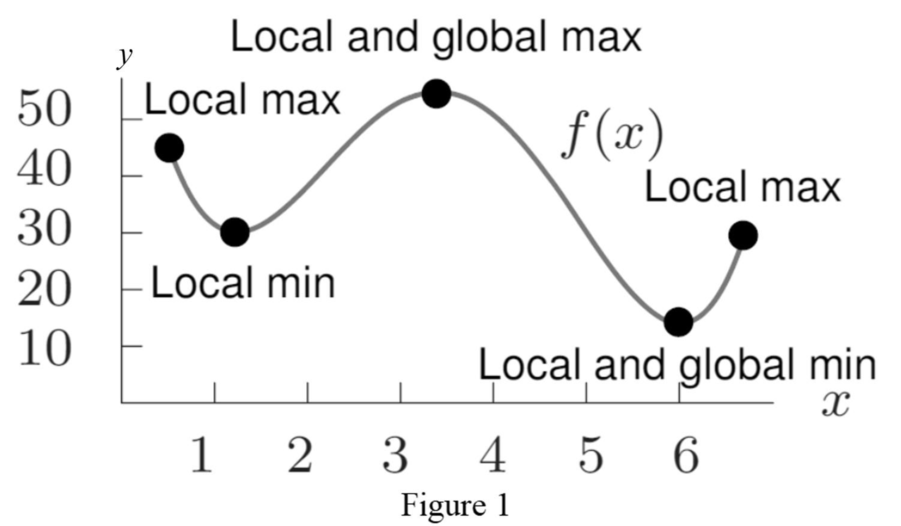
From Figure 1, it is notices that all critical points on the graph is showed.
Want to see more full solutions like this?
Chapter 4 Solutions
Calculus: Single And Multivariable
Additional Math Textbook Solutions
Precalculus: Mathematics for Calculus - 6th Edition
Calculus and Its Applications (11th Edition)
Calculus & Its Applications (14th Edition)
Precalculus: Concepts Through Functions, A Unit Circle Approach to Trigonometry (4th Edition)
Calculus 2012 Student Edition (by Finney/Demana/Waits/Kennedy)
Single Variable Calculus: Early Transcendentals (2nd Edition) - Standalone book


- In Exercises 3–10, differentiate the expression with respect to x, assuming that y is implicitly a function of x.arrow_forwardThe following graph shows a rough approximation of historical and projected median home prices for a country for the period 2000–2024. Insert graph here: Here, t is time in years since the start of 2000, and C(t) is the median home price in thousands of dollars. The locations of stationary points and points of inflection are indicated on the graph. Analyze the graph's important features, and interpret each feature in terms of the median home price. The median home price was $_________ thousand at the start of 2000 (t = 0). The median home price has two low points; first in the year_______ and again in the year___________ when it stood at $________ thousand; The median home price peaked at the start of the year__________ at $_________ thousand. The median home price was decreasing most rapidly at the start of the year__________ when it was $___________ thousand, and increasing most rapidly at the start of the year__________ when it was $_________ thousand. Assuming…arrow_forwardFor Problems 4 – 8, let S be an uncountable set. Label each of the following statements as true or false, and justify your answer. There exists a bijective function f : J → S.arrow_forward
- In Exercises 83–85, you will use a CAS to help find the absolute extrema of the given function over the specified closed interval. Per-form the following steps. a. Plot the function over the interval to see its general behavior there. b. Find the interior points where ƒ′ = 0. (In some exercises, you may have to use the numerical equation solver to ap-proximate a solution.) You may want to plot ƒ′ as well. c. Find the interior points where ƒ′ does not exist. d. Evaluate the function at all points found in parts (b) and (c) and at the endpoints of the interval. e. Find the function’s absolute extreme values on the interval and identify where they occur. 83. ƒ(x) = x4 - 8x2 + 4x + 2, [-20/25, 64/25] 84. ƒ(x) = -x4 + 4x3 - 4x + 1, [-3/4, 3] 85. ƒ(x) = x^(2/3)(3 - x), [-2, 2]arrow_forwardIn Exercises 5–10, find an appropriate graphing software viewing window for the given function and use it to display its graph. The win-dow should give a picture of the overall behavior of the function. There is more than one choice, but incorrect choices can miss impor-tant aspects of the function. 5. ƒ(x) = x4 - 4x3 + 15 6. ƒ(x) = x5 - 5x4 + 10 7. ƒ(x) = x sqrt(9 - x2) 8. ƒ(x) = x3 /3 - x2/ 2 - 2x + 1 9. ƒ(x) = 4x3 - x4 10. ƒ(x) = x2(6 - x3)arrow_forwardIn the section opener, we saw that 80x – 8000 f(x) 30 s xs 100 110 models the government tax revenue, f(x), in tens of billions of dollars, as a function of the tax rate percentage, x. Use this function to solve Exercises 55–58. Round to the nearest ten billion dollars. 55. Find and interpret f(30). Identify the solution as a point on the graph of the function in Figure 6.4 on page 439. 56. Find and interpret f(70). Identify the solution as a point on the graph of the function in Figure 6.4 on page 439. 57. Rewrite the function by using long division to perform (80x - 8000) - (x - 110). Then use this new form of the function to find f(30). Do you obtain the same answer as you did in Exercise 55? Which form of the function do you find easier to use? 58. Rewrite the function by using long division to perform (80x – 8000) - (x – 110).arrow_forward
- In Exercises 15–22, calculate the approximation for the given function and interval.arrow_forwardPage 12. Graph. -2 for x 2arrow_forwardIn Problems 49–56, for each graph of a function y = f(x), find the absolute maximum and the absolute minimum, if they exist. Identify any local maximum values or local minimum values.arrow_forward
- In Problems 31–42:(a) Find the domain of each function. (b) Locate any intercepts. (c) Graph each function.(d) Based on the graph, find the range. (e) Is f continuous on its domain?arrow_forwardIn Problems 11–18, match each graph to its function. A. Constant function E. Square root function B. Identity function F. Reciprocal function C. Square function G. Absolute value function D. Cube function H. Cube root function 11. 12. 13. 14. 15. 16. 17. 18.arrow_forward5.) Sketch the graph. f(x) = x³ + x² - x +1 %3Darrow_forward
 Algebra & Trigonometry with Analytic GeometryAlgebraISBN:9781133382119Author:SwokowskiPublisher:Cengage