
Introduction To Statistics And Data Analysis
6th Edition
ISBN: 9781337793612
Author: PECK, Roxy.
Publisher: Cengage Learning,
expand_more
expand_more
format_list_bulleted
Concept explainers
Videos
Textbook Question
Chapter 5.4, Problem 54E
The following data on x = Frying time (in seconds) and y = Moisture content (%) appeared in the paper “Thermal and Physical Properties of Tortilla Chips as a
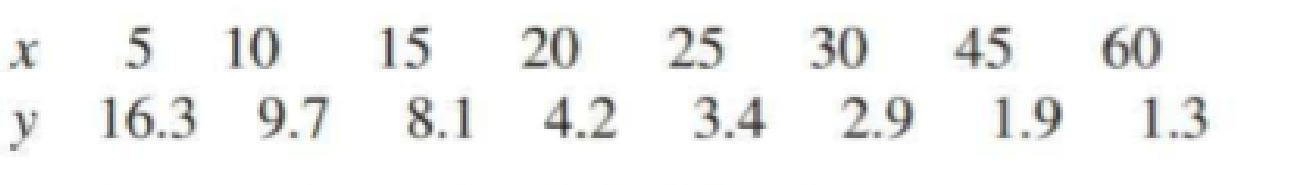
- a. Construct a
scatterplot of the data. - b. Would a line provide an effective summary of the relationship? Explain.
Expert Solution & Answer

Trending nowThis is a popular solution!

Students have asked these similar questions
The spotted lanternfly, Lycorma delicatula, is an invasive species to the United States that has the potential to do significant agricultural damage. An ecologist is studying the relationship between the size of the female spotted lanternflies and the number of eggs they produce. The data are summarized below.
Length of insect: AVG = 1 inch, SD = 0.15 inchNumber of eggs: AVG = 40 eggs, SD = 5 eggsr = 0.2
Using regression, we can say that the average number of eggs produced by female spotted lanternflies who are 1.1 inch long is closest to...
Group of answer choices
42
39
40
41
A study of the amount of rainfall and the quantity of air pollution removed produced the following data shown in table below:
Daily Rainfall
x (0.01 cm)
Particulate Removed
y (μg/m3)
7
126
7.9
129.3
7.5
125.3
9.2
120.2
10.8
116.7
5.8
119.2
5.6
138.7
2.7
147.5
9.2
110.3
Compute and interpret the coefficient of determination, and coefficient of correlation for the given data.
What will be the regression equation, when swapped depended and independent variable
An article in the Journal of Environmental Engineering (1989, Vol. 115(3), pp.
608–619) reported the results of a study on the occurrence of sodium and chloride in surface
streams in central Rhode Island. The following data are chloride concentration y (in milligrams per
liter) and roadway area in the watershed x (in percentage).
Chapter 5 Solutions
Introduction To Statistics And Data Analysis
Ch. 5.1 - For each of the scatterplots shown, answer the...Ch. 5.1 - For each of the following pairs of variables,...Ch. 5.1 - For each of the following pairs of variables,...Ch. 5.1 - For each of the following pairs of variables,...Ch. 5.1 - Is the following statement correct? Explain why or...Ch. 5.1 - Draw a scatterplot for which r = 1.Ch. 5.1 - Draw a scatterplot for which r = 1.Ch. 5.1 - Each year J.D. Power and Associates surveys new...Ch. 5.1 - The accompanying data are x = Cost (cents per...Ch. 5.1 - The authors of the paper Flat-footedness Is Not a...
Ch. 5.1 - The paper The Relationship Between Cell Phone Use,...Ch. 5.1 - Data from the U.S. Federal Reserve Board (federal...Ch. 5.1 - The article 115K! The 13 Best Paying U.S....Ch. 5.1 - It may seem odd, but one of the ways biologists...Ch. 5.1 - An auction house released a list of 25 recently...Ch. 5.1 - A sample of automobiles traversing a certain...Ch. 5.2 - Two scatterplots are shown below. Explain why it...Ch. 5.2 - The authors of the paper Statistical Methods for...Ch. 5.2 - The accompanying data are a subset of data from...Ch. 5.2 - The authors of the paper Evaluating Existing...Ch. 5.2 - The authors of the paper referenced in the...Ch. 5.2 - A sample of 548 ethnically diverse students from...Ch. 5.2 - The relationship between hospital patient-to-nurse...Ch. 5.2 - The report Airline Quality Rating 2016...Ch. 5.2 - Acrylamide is a chemical that is sometimes found...Ch. 5.2 - Use the acrylamide data given in the previous...Ch. 5.2 - Studies have shown that people who suffer sudden...Ch. 5.2 - The data given in the previous exercise on x =...Ch. 5.2 - An article on the cost of housing in Califomia...Ch. 5.2 - The following data on sale price, size, and...Ch. 5.2 - Explain why it can be dangerous to use the...Ch. 5.2 - The sales manager of a large company selected a...Ch. 5.2 - Explain why the slope b of the least-squares line...Ch. 5.2 - Prob. 34ECh. 5.3 - Does it pay to stay in school? The report Trends...Ch. 5.3 - The data in the accompanying table is from the...Ch. 5.3 - The paper referenced in the previous exercise also...Ch. 5.3 - Consider the residual plot from the previous...Ch. 5.3 - The report Airline Quality Rating 2016...Ch. 5.3 - Acrylamide is a chemical that is sometimes found...Ch. 5.3 - Consider the scatterplot of acrylamide...Ch. 5.3 - Some types of algae have the potential to cause...Ch. 5.3 - The relationship between x = Total number of...Ch. 5.3 - The residuals from the least-squares line for the...Ch. 5.3 - The first Batman movie was made over 50 years ago...Ch. 5.3 - The article 115K! The 13 Best Paying U.S....Ch. 5.3 - The article Examined Life: What Stanley H. Kaplan...Ch. 5.3 - The accompanying data are a subset of data from...Ch. 5.3 - The article California State Parks Closure List...Ch. 5.3 - The article referenced in the previous exercise...Ch. 5.3 - A study was carried out to investigate the...Ch. 5.3 - Both r2 and se are used to assess the fit of a...Ch. 5.3 - Prob. 53ECh. 5.4 - The following data on x = Frying time (in seconds)...Ch. 5.4 - Use the information provided in the previous...Ch. 5.4 - The paper Aspects of Food Finding by Wintering...Ch. 5.4 - Food intake of grazing animals is limited by the...Ch. 5.4 - A study, described in the paper Prediction of...Ch. 5.4 - Prob. 59ECh. 5.4 - The following table gives the number of heart...Ch. 5.4 - Refer to the heart transplant data given in the...Ch. 5.4 - The paper Population Pressure and Agricultural...Ch. 5.4 - Determining the age of an animal can sometimes be...Ch. 5.5 - The paper How Lead Exposure Relates to Temporal...Ch. 5.5 - The following quote is from the paper Evaluation...Ch. 5 - The accompanying data represent x = Amount of...Ch. 5 - The paper A Cross-National Relationship Between...Ch. 5 - The following data on x = Score on a measure of...Ch. 5 - The paper Effects of Canine Parvovirus (CPV) on...Ch. 5 - The paper Depression, Body Mass Index, and Chronic...Ch. 5 - The paper Aspects of Food Finding by Wintering...Ch. 5 - Data on salmon availability (x) and the percentage...Ch. 5 - No tortilla chip lover likes soggy chips, so it is...Ch. 5 - The article Reduction is Soluble Protein and...Ch. 5 - The following quote is from the paper The Weight...Ch. 5 - An accurate assessment of oxygen consumption...Ch. 5 - Consider the four (x, y) pairs (0, 0), (1, 1), 1,...Ch. 5 - Prob. 1CRECh. 5 - Data from a survey of 1046 adults age 50 and older...Ch. 5 - Prob. 3CRECh. 5 - Prob. 4CRECh. 5 - Prob. 5CRECh. 5 - The amount of money spent each year on science,...Ch. 5 - Below are the data used to construct the time...Ch. 5 - In August 2009, Harris Interactive released the...Ch. 5 - Prob. 9CRECh. 5 - Prob. 10CRECh. 5 - Prob. 11CRECh. 5 - Prob. 12CRECh. 5 - Cost-to-charge ratios (the percentage of the...Ch. 5 - In the article Reproductive Biology of the Aquatic...Ch. 5 - Prob. 15CRECh. 5 - Anabolic steroid abuse has been increasing despite...Ch. 5 - Prob. 81ECh. 5 - Prob. 82ECh. 5 - Prob. 83ECh. 5 - Prob. 84ECh. 5 - Suppose the hypothetical data below are from a...Ch. 5 - Prob. 86E
Knowledge Booster


Learn more about
Need a deep-dive on the concept behind this application? Look no further. Learn more about this topic, statistics and related others by exploring similar questions and additional content below.Similar questions
- Find the equation of the regression line for the following data set. x 1 2 3 y 0 3 4arrow_forwardFor the following table of data. x 1 2 3 4 5 6 7 8 9 10 y 0 0.5 1 2 2.5 3 3 4 4.5 5 a. draw a scatterplot. b. calculate the correlation coefficient. c. calculate the least squares line and graph it on the scatterplot. d. predict the y value when x is 11.arrow_forwardOcean currents are important in studies of climate change, as well as ecology studies of dispersal of plankton. Drift bottles are used to study ocean currents in the Pacific near Hawaii, the Solomon Islands, New Guinea, and other islands. Let x represent the number of days to recovery of a drift bottle after release and y represent the distance from point of release to point of recovery in km/100. The following data are representative of one study using drift bottles to study ocean currents. 203 x days y km/100 72 76 32 14.7 94 11.7 19.5 5.3 35.6 (a) Verify that Ex = 477, Ey = 86.8, Ex? = 62,029, Ey2 = 2028.68, Exy = 11036.6, and r= 0.93853. Ex Ey Ex? Ey2| Exy (b) Use a 1% level of significance to test the claim p> 0. (Use 2 decimal places.) critical t Conclusion Reject the null hypothesis, there is sufficient evidence that p > 0. Reject the null hypothesis, there is insufficient evidence that p > 0. O Fail to reject the null hypothesis, there is insufficient evidence that p > 0. O…arrow_forward
- Ocean currents are important in studies of climate change, as well as ecology studies of dispersal of plankton. Drift bottles are used to study ocean currents in the Pacific near Hawaii, the Solomon Islands, New Guinea, and other islands. Let x represent the number of days to recovery of a drift bottle after release and y represent the distance from point of release to point of recovery in km/100. The following data are representative of one study using drift bottles to study ocean currents. x days 76 79 36 95 207 y km/100 14.2 19.6 5.4 11.2 35.9 (a) Verify that Σx = 493, Σy = 86.3, Σx2 = 65,187, Σy2 = 2029.21, Σxy = 11317.3, and r ≈ 0.93885. Σx Σy Σx2 Σy2 Σxy r (b) Use a 1% level of significance to test the claim ρ > 0. (Use 2 decimal places.) t critical t (c) Verify that Se ≈ 4.6183, a ≈ 0.5575, and b ≈ 0.1694. Se a b Find the predicted distance (km/100) when a drift bottle has been floating for 60 days. (Use 2…arrow_forwardThis dataset includes measurements of soil temperature and soil respiration at three places along the riverbank (upper, mid, and lower; the upper site is far away from water and the lower site is close to water). Please help describe and interpret the results below:arrow_forwardA sociologist wants to determine if the life expectancy of people in Africa is less than the life expectancy of people in Asia. The data obtained is shown in the table below. Africa Asia = 63.3 yr. 1 X,=65.2 yr. 2 o, = 9.1 yr. = 7.3 yr. n1 = 120 = 150arrow_forward
- Ocean currents are important in studies of climate change, as well as ecology studies of dispersal of plankton. Drift bottles are used to study ocean currents in the Pacific near Hawaii, the Solomon Islands, New Guinea, and other islands. Let x represent the number of days to recovery of a drift bottle after release and y represent the distance from point of release to point of recovery in km/100. The following data are representative of one study using drift bottles to study ocean currents. x days 74 77 34 96 208 y km/100 14.9 19.1 5.8 11.9 35.7 (a) Find Σx, Σy, Σx2, Σy2, Σxy, and r. (Round r to three decimal places.) Σx = Σy = Σx2 = Σy2 = Σxy = r = (b) Use a 1% level of significance to test the claim ρ > 0. (Round your answers to two decimal places.) t = critical t = Conclusion Reject the null hypothesis, there is sufficient evidence that ρ > 0.Reject the null hypothesis, there is insufficient evidence that ρ >…arrow_forwardFind the new data point (x,y) in which x=2 from the data points (1.3) and (4.12)arrow_forwardTurbid water is muddy or cloudy water. Sunlight is necessary for most life forms; thus turbid water is considered a threat to wetland ecosystems. Passive filtration systems are commonly used to reduce turbidity in wetlands. Suspended solids are measured in mg/l. Is there a relation between input and output turbidity for a passive filtration system and, if so, is it statistically significant? At a wetlands environment in Illinois, the inlet and outlet turbidity of a passive filtration system have been measured. A random sample of measurements are shown below. (Reference: EPA Wetland Case Studies.) Reading Inlet (mg/l) Outlet (mg/l) 3 4 5 6 7 8 9 10 11 12 31.6 86.9 87.0 12.0 45.4 43.3 32.3 77.7 71.7 85.9 64.9 80.1 3.3 14.2 16.8 5.7 4.6 6.2 3.4 7.7 8.0 7.4 8.7 14.3 Use a 1% level of significance to test the claim that there is a monotone relationship (either way) between the ranks of the inlet readings and outlet readings. (a) Rank-order the inlet readings using 1 as the largest data…arrow_forward
- Pls. help me in my stat about CORRELATION ANALYSIS, SIMPLE REGRESSION ANALYSIS AND PATH ANALYSIS IN Rarrow_forwardTurbid water is muddy or cloudy water. Sunlight is necessary for most life forms; thus turbid water is considered a threat to wetland ecosystems. Passive filtration systems are commonly used to reduce turbidity in wetlands. Suspended solids are measured in mg/l. Is there a relation between input and output turbidity for a passive filtration system and, if so, is it statistically significant? At a wetlands environment in Illinois, the inlet and outlet turbidity of a passive filtration system have been measured. A random sample of measurements are shown below. (Reference: EPA Wetland Case Studies.) Reading 1 2 3 4 5 6 7 8 9 10 11 12 Inlet (mg/l) 59.1 25.7 70.5 71.0 37.6 43.5 13.1 24.2 16.7 49.1 67.6 31.7 Outlet (mg/l) 18.2 14.3 15.3 17.5 13.1 8.0 4.1 4.4 4.3 5.8 16.3 7.1 Use a 1% level of significance to test the claim that there is a monotone relationship (either way) between the ranks of the inlet readings and outlet readings. (a) Rank-order the inlet readings using 1 as…arrow_forwardTurbid water is muddy or cloudy water. Sunlight is necessary for most life forms; thus turbid water is considered a threat to wetland ecosystems. Passive filtration systems are commonly used to reduce turbidity in wetlands. Suspended solids are measured in mg/l. Is there a relation between input and output turbidity for a passive filtration system and, if so, is it statistically significant? At a wetlands environment in Illinois, the inlet and outlet turbidity of a passive filtration system have been measured. A random sample of measurements are shown below. (Reference: EPA Wetland Case Studies.) Use a 1% level of significance to test the claim that there is a monotone relationship (either way) between the ranks of the inlet readings and outlet readings. (a) Rank-order the inlet readings using 1 as the largest data value. Also rank-order the outlet readings using 1 as the largest data value. Then construct a table of ranks to be used for a Spearman rank correlation test. (c) Compute…arrow_forward
arrow_back_ios
SEE MORE QUESTIONS
arrow_forward_ios
Recommended textbooks for you
 Calculus For The Life SciencesCalculusISBN:9780321964038Author:GREENWELL, Raymond N., RITCHEY, Nathan P., Lial, Margaret L.Publisher:Pearson Addison Wesley,
 Algebra & Trigonometry with Analytic GeometryAlgebraISBN:9781133382119Author:SwokowskiPublisher:Cengage
 Glencoe Algebra 1, Student Edition, 9780079039897...AlgebraISBN:9780079039897Author:CarterPublisher:McGraw Hill
 Functions and Change: A Modeling Approach to Coll...AlgebraISBN:9781337111348Author:Bruce Crauder, Benny Evans, Alan NoellPublisher:Cengage Learning
Calculus For The Life Sciences
Calculus
ISBN:9780321964038
Author:GREENWELL, Raymond N., RITCHEY, Nathan P., Lial, Margaret L.
Publisher:Pearson Addison Wesley,
Algebra & Trigonometry with Analytic Geometry
Algebra
ISBN:9781133382119
Author:Swokowski
Publisher:Cengage
Glencoe Algebra 1, Student Edition, 9780079039897...
Algebra
ISBN:9780079039897
Author:Carter
Publisher:McGraw Hill
Functions and Change: A Modeling Approach to Coll...
Algebra
ISBN:9781337111348
Author:Bruce Crauder, Benny Evans, Alan Noell
Publisher:Cengage Learning
Correlation Vs Regression: Difference Between them with definition & Comparison Chart; Author: Key Differences;https://www.youtube.com/watch?v=Ou2QGSJVd0U;License: Standard YouTube License, CC-BY
Correlation and Regression: Concepts with Illustrative examples; Author: LEARN & APPLY : Lean and Six Sigma;https://www.youtube.com/watch?v=xTpHD5WLuoA;License: Standard YouTube License, CC-BY