
Videos
The article “Simulation of the Hot Carbonate Process for Removal of CO2 and H2S from Medium Btu Gas” (K. Park and T. Edgar, Energy Progress, 1984:174–180) presents an equation used to estimate the equilibrium vapor pressure of CO2 in a potassium carbonate solution. The actual equilibrium pressure (in kPa) was measured in nine different reactions and compared with the value estimated from the equation. The results are presented in the following table:
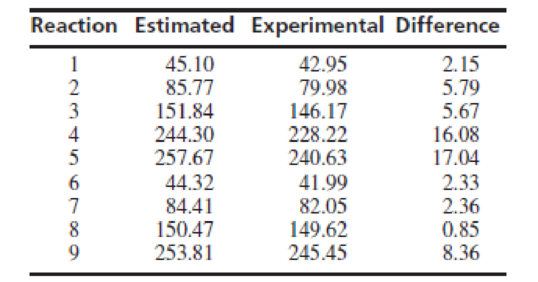
Find a 95% confidence interval for the
Want to see the full answer?
Check out a sample textbook solution
Chapter 5 Solutions
Statistics for Engineers and Scientists
Additional Math Textbook Solutions
Statistics for Business and Economics (13th Edition)
Statistics: Informed Decisions Using Data (5th Edition)
Introductory Statistics
Statistics Through Applications


- Scientists are looking at the effects of global warming on clutches of sea turtle hatchlings in different parts of the world. The data below has been collected: 1.Temperature of Incubation (in Kelvin) 2. Gender Group of Hatchling Clutch (0=0% male; 1= greater than 0% but less than or equal to 10% male; 2= greater than 10% but less than 20% male; 3= greater than 20% but less than or equal to 30% male and so on) 3. Number of hatched eggs 4. number of unhatched eggs 5. Location of Turtles (0=west North America; 1= west South America; 2= tropical regions of Pacific; 3= northwestern Atlantic; 4= Indian Ocean Which of the above variables are measured using a nominal scale, ordinal scale and ratio scale. (An answer can be none of variables) thank youarrow_forwardData from the US Department of Energy’s US Energy Information Administration (eia.doe.gov) provides a look at the energy-related carbon dioxide emissions by end use sector (residential, commercial, industrial, transportation) from years 1990 to 2009. (Report # DOE/EIA0573(2009)). Here we would like to see if the CO2 emissions from the Industrial sector are less than that from the Transportation sector. Below are the results: 14. What type of study is this? a. Paired b. Two-Sample Independent 15. What type of plot would we use? a. Histogram of the differences b. Side-by-side boxplots c. Pie chart d. Bar graph 16. Was the HOV/pooled test used above (hint: look at the df)? YES NO 17. Is there evidence that the CO2 emissions from the Industrial sector are less than that from the Transportation sector? YES NO 18. If we were to test to see if there was a difference between the CO2 emissions from the Industrial sector and the Transportation sector, what would be the p-value? (report to 3…arrow_forwardThe standard pH of a drinking water of MRWD is pH 7.0, the pH obtained from several water station are as follows: Station 1 7.8 Station 2 6.5 Station 3 5.8 Station 4 8.9 Station 5 6.8 Station 6 5.8 Station 7 9.0 Station 8 6.9 Test the hypothesis that the drinking water of the MRWD is safe for drinking.arrow_forward
- 3. In a study of the relationship of the shape of a tablet to its dissolution time, 6 disk-shaped ibuprofen tablets and 8 oval-shaped ibuprofen tablets were dissolved in water. The dissolve times, in seconds, were as follows: Disk: 269.0 249.3 255.2 252.7 247.0 261.6 268.8 260.0 273.5 253.9 278.5 289.4 Oval: 261.6 280.2 Can you conclude that the mean dissolve times differ between the two shapes?arrow_forwardChlorophylls a and b are plant pigments that absorb sunlight and transfer the energy into photosynthesis of carbohydrates from CO2 and H2O, releasing O2 in the process. Chlorophylls were extracted from chopped up grass and measured by spectrophotometry. The table shows results for chlorophyll a for four separate analysis of five blades of grass. Chlorophyll a (g/L) Blade 1 Blade 2 Blade 3 Blade 4 Blade 5 1.09 1.26 1.1 1.23 0.85 0.86 0.96 1.21 1.3 0.65 0.93 0.8 1.27 0.97 0.86 0.99 0.73 1.12 0.97 1.03 Four replicate measurements for each blade of grass tell us the precision of the analytical procedure (sanalysis). Differences between mean values for each of the five blades of grass are a measure of variation due to sampling (ssampling). Using Excel and it’s ANOVA function, find the standard deviations attributable to sampling and to analysis, as well as the overall standard deviation arising from both sources.arrow_forward3. (Inspired by 4.10 in Bodine et al.) The basal metabolic rate (kcal/day) of large anteaters is believed to be subject to a power law relationship with its weight (kg). A study was performed measuring several anteaters and reported the following data: Weight (kg) 6.0 28.5 16.0 19.0 23.5 11.0 9.0 25.5 22.0 BMR (kcal/day) 80.1 247.0 162.3 172.4 215.1 111.9 104.6 224.6 208.3arrow_forward
- 3. (Inspired by 4.10 in Bodine et al.) The basal metabolic rate (kcal/day) of large anteaters is believed to be subject to a power law relationship with its weight (kg). A study was performed measuring several anteaters and reported the following data: Weight (kg) 6.0 28.5 16.0 19.0 23.5 11.0 9.0 25.5 22.0 BMR (kcal/day) 80.1 247.0 162.3 172.4 215.1 111.9 104.6 224.6 208.3 Transform the data correctly to perform a linear least-squares regression, then report your model as y=cxp. Estimate the BMR for a 27 kg anteater.arrow_forwardWhich answer is correct for the cut-off grade and ore-grade of a deposit generating $4/t profit at 80% recovery, mineral price of $20/kg and total mining and processing cost of $16/t? Select one: OA 0.1% and 0.125% OB 1% and 1.25% OC. 10% and 12.5% O D. 0.01% and 0.0125% OE. 0.1 and 0.125 OF 0.01 and 0.0125 OG. 0.8 kg/t and 1 kg/tarrow_forward17.7 Butterfly wings. Researchers studied the morphological attributes of monarch butterflies (Danaus plexippus), a species that undertakes large seasonal migrations over North America. They measured the forewing weight (in milligrams, mg) of a sample of 92 monarch butterflies, all of which had been reared in captivity in identical conditions.° Figure 17.4 shows the output from the statistical software JMP. (The data are also available in the Large.Butterfly the data file if you wish to practice working with your own software.) Estimate with 95% confidence the mean forewing weight of monarch butterflies reared in captivity. Follow the four- step process as illustrated in Example 17.2. 4 STEP そMP FWweight 30 25 20 15 10 11 12 13 14 15 8 9 10 Summary Statistics Mean 11.795652 Std Dev 1.1759413 Std Err Mean 0.1226004 Upper 95% Mean Lower 95% Mean 1 FIGURE 17.4 Software output (JMP) for the forewing weight of monarch 12.039183 11.552122 92 N. butterflies. Countarrow_forward
- To study the effect of temperature on yield in a chemical process, five batches were produced at each of three temperature levels. The results follow.arrow_forwardA sociologist wants to determine if the life expectancy of people in Africa is less than the life expectancy of people in Asia. The data obtained is shown in the table below. Africa Asia = 63.3 yr. 1 X,=65.2 yr. 2 o, = 9.1 yr. = 7.3 yr. n1 = 120 = 150arrow_forwardIn the production of synthetic motor lubricant from coal, a new catalyst has been discovered that seems to affect the viscosity index of the lubricant. In an experiment consisting of 23 production runs, 11 used the new catalyst and 12 did not. After each production run, the viscosity index of the lubricant was determined to be as follows. With catalyst 4.0 4.4 2.6 1.2 3.9 4.2 2.8 3.2 4.1 2.1 1.6 Without catalyst 3.3 2.3 3.7 3.0 4.3 2.7 4.5 1.5 3.6 2.5 2.2 3.4 The two samples are independent. Use a 0.01 level of significance to test the null hypothesis that the viscosity index is unchanged by the catalyst against the alternate hypothesis that the viscosity index has changed. 1.) Find the sample test statistic. (Use 2 decimal places.)2.) For the sign test, rank-sum test, and Spearman correlation coefficient test, find the P-value of the sample test statistic. For the runs test of randomness, find the critical values from Table 10 of Appendix II. (Use 4 decimal places.)arrow_forward
 MATLAB: An Introduction with ApplicationsStatisticsISBN:9781119256830Author:Amos GilatPublisher:John Wiley & Sons Inc
 Probability and Statistics for Engineering and th...StatisticsISBN:9781305251809Author:Jay L. DevorePublisher:Cengage Learning
 Statistics for The Behavioral Sciences (MindTap C...StatisticsISBN:9781305504912Author:Frederick J Gravetter, Larry B. WallnauPublisher:Cengage Learning
 Elementary Statistics: Picturing the World (7th E...StatisticsISBN:9780134683416Author:Ron Larson, Betsy FarberPublisher:PEARSON
 The Basic Practice of StatisticsStatisticsISBN:9781319042578Author:David S. Moore, William I. Notz, Michael A. FlignerPublisher:W. H. Freeman
 Introduction to the Practice of StatisticsStatisticsISBN:9781319013387Author:David S. Moore, George P. McCabe, Bruce A. CraigPublisher:W. H. Freeman