
Statistics for Engineers and Scientists
4th Edition
ISBN: 9780073401331
Author: William Navidi Prof.
Publisher: McGraw-Hill Education
expand_more
expand_more
format_list_bulleted
Videos
Textbook Question
Chapter 8.2, Problem 1E
In an experiment to determine factors related to weld toughness, the Charpy V-notch impact toughness in ft·lb (y) was measured for 22 welds at 0°C, along with the lateral expansion at the notch in % (x1), and the brittle fracture surface in % (x2). The data are presented in the following table.
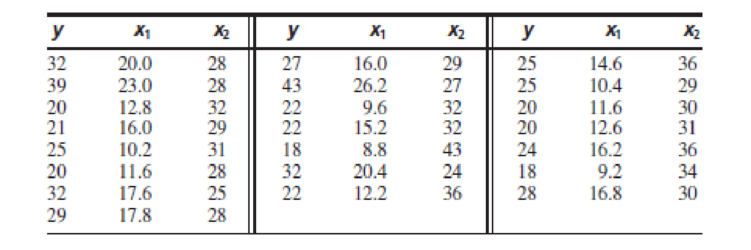
- a. Fit the model y = β0 + β1x1 + ε. For each coefficient, test the null hypothesis that it is equal to 0.
- b. Fit the model y = β0 + β1x2 + ε. For each coefficient, test the null hypothesis that it is equal to 0.
- c. Fit the model y = β0 + β1x1 + β2x2 + ε. For each coefficient, test the null hypothesis that it is equal to 0.
- d. Which of the models in parts (a) through (c) is the best of the three? Why do you think so?
Expert Solution & Answer
Want to see the full answer?
Check out a sample textbook solution
Students have asked these similar questions
In an experiment to determine factors related to weld toughness, the Charpy V-notch impact
toughness in ft - 1b (v) was measured for 22 welds at 0°Č, along with the lateral expansion
at the notch in % (x,), and the brittle fracture surface in % (x2). The data are presented in the
following table.
X1
X2
y
32
20.0
28
39
23.0
28
20
12.8
32
21
16.0
29
25
10.2
31
20
11.6
28
32
17.6
25
29
17.8
28
27
16.0
29
43
26.2
27
22
9.6
32
22
15.2
32
18
8.8
43
32
20.4
24
22
12.2
36
25
14.6
36
25
10.4
29
20
11.6
30
20
12.6
31
24
16.2
36
18
9.2
34
28
16.8
30
a. Fit the model y = Bo + B1 X1 + ɛ. For each coefficient, test the null hypothesis that it is
equal to 0.
b. Fit the model y = Bo + B, xz + ɛ. For each coefficient, test the null hypothesis that it is
equal to 0.
c. Fit the model y = Bo + B1 X1 + Bzx2 + ɛ. For each coefficient, test the null hypothesis
that it is equal to 0.
d. Which of the models in parts (a) through (c) is the best of the three? Why do you think
%3D
+ E.
so?
Computer chips often contain surface imperfections.For a certain type of computer chip, theprobability mass function of the number of defects X is presented in the following table.
An experiment to compare the tension bond strength of polymer latex modified mortar (Portland cement mortar to which polymer latex emulsions have been added during mixing) to that of unmodified mortar resulted in x = 18.18 kgf/cm2 for the
modified mortar (m = 42) and y = 16.86 kgf/cm for the unmodified mortar (n = 30). Let µ1 and Hz be the true average tension bond strengths for the modified and unmodified mortars, respectively. Assume that the bond strength distributions
are both normal.
(a) Assuming that o1 = 1.6 and o2 = 1.3, test Ho: µ1 - 42 = 0 versus H3: µ1 – 42 > 0 at level 0.01.
Calculate the test statistic and determine the P-value. (Round your test statistic to two decimal places and your P-value to four decimal places.)
z =
P-value =
State the conclusion in the problem context.
Fail to reject Ho: The data does not suggest that the difference in average tension bond strengths exceeds from 0.
o Reject Ho: The data does not suggest that the difference in average tension bond…
Chapter 8 Solutions
Statistics for Engineers and Scientists
Ch. 8.1 - In an experiment to determine the factors...Ch. 8.1 - Prob. 2ECh. 8.1 - Prob. 3ECh. 8.1 - The article Application of Analysis of Variance to...Ch. 8.1 - Prob. 5ECh. 8.1 - Prob. 6ECh. 8.1 - Prob. 7ECh. 8.1 - Refer to Exercise 7. a. Find a 95% confidence...Ch. 8.1 - In a study of the lung function of children, the...Ch. 8.1 - Prob. 10E
Ch. 8.1 - Prob. 11ECh. 8.1 - The following MINITAB output is for a multiple...Ch. 8.1 - Prob. 13ECh. 8.1 - Prob. 14ECh. 8.1 - Prob. 15ECh. 8.1 - The following data were collected in an experiment...Ch. 8.1 - The November 24, 2001, issue of The Economist...Ch. 8.1 - The article Multiple Linear Regression for Lake...Ch. 8.1 - Prob. 19ECh. 8.2 - In an experiment to determine factors related to...Ch. 8.2 - In a laboratory test of a new engine design, the...Ch. 8.2 - In a laboratory test of a new engine design, the...Ch. 8.2 - The article Influence of Freezing Temperature on...Ch. 8.2 - The article Influence of Freezing Temperature on...Ch. 8.2 - The article Influence of Freezing Temperature on...Ch. 8.3 - True or false: a. For any set of data, there is...Ch. 8.3 - The article Experimental Design Approach for the...Ch. 8.3 - Prob. 3ECh. 8.3 - An engineer measures a dependent variable y and...Ch. 8.3 - Prob. 5ECh. 8.3 - The following MINITAB output is for a best subsets...Ch. 8.3 - Prob. 7ECh. 8.3 - Prob. 8ECh. 8.3 - (Continues Exercise 7 in Section 8.1.) To try to...Ch. 8.3 - Prob. 10ECh. 8.3 - Prob. 11ECh. 8.3 - Prob. 12ECh. 8.3 - The article Ultimate Load Analysis of Plate...Ch. 8.3 - Prob. 14ECh. 8.3 - Prob. 15ECh. 8.3 - Prob. 16ECh. 8.3 - The article Modeling Resilient Modulus and...Ch. 8.3 - The article Models for Assessing Hoisting Times of...Ch. 8 - The article Advances in Oxygen Equivalence...Ch. 8 - Prob. 2SECh. 8 - Prob. 3SECh. 8 - Prob. 4SECh. 8 - In a simulation of 30 mobile computer networks,...Ch. 8 - The data in Table SE6 (page 649) consist of yield...Ch. 8 - Prob. 7SECh. 8 - Prob. 8SECh. 8 - Refer to Exercise 2 in Section 8.2. a. Using each...Ch. 8 - Prob. 10SECh. 8 - The data presented in the following table give the...Ch. 8 - The article Enthalpies and Entropies of Transfer...Ch. 8 - Prob. 13SECh. 8 - Prob. 14SECh. 8 - The article Measurements of the Thermal...Ch. 8 - The article Electrical Impedance Variation with...Ch. 8 - The article Groundwater Electromagnetic Imaging in...Ch. 8 - Prob. 18SECh. 8 - Prob. 19SECh. 8 - Prob. 20SECh. 8 - Prob. 21SECh. 8 - Prob. 22SECh. 8 - The article Estimating Resource Requirements at...Ch. 8 - Prob. 24SE
Additional Math Textbook Solutions
Find more solutions based on key concepts
AVX Home Entertainment, Inc., recently began a “no-hassles” return policy. A sample of 500 customers who recent...
EBK STATISTICAL TECHNIQUES IN BUSINESS
Testing Hypotheses. In Exercises 13-24, assume that a simple random sample has been selected and test the given...
Elementary Statistics Using the TI-83/84 Plus Calculator, Books a la Carte Edition (4th Edition)
Refer to the Real Estate data, which reports information on homes sold in the Goodyear, Arizona, area during th...
Statistical Techniques in Business and Economics
c
Solve.
70. Copy Center Account. Rachel’s copy-center bill for July was $327. She made a payment of $200 and t...
Developmental Mathematics (9th Edition)
Knowledge Booster


Learn more about
Need a deep-dive on the concept behind this application? Look no further. Learn more about this topic, statistics and related others by exploring similar questions and additional content below.Similar questions
- 17.7 Butterfly wings. Researchers studied the morphological attributes of monarch butterflies (Danaus plexippus), a species that undertakes large seasonal migrations over North America. They measured the forewing weight (in milligrams, mg) of a sample of 92 monarch butterflies, all of which had been reared in captivity in identical conditions.° Figure 17.4 shows the output from the statistical software JMP. (The data are also available in the Large.Butterfly the data file if you wish to practice working with your own software.) Estimate with 95% confidence the mean forewing weight of monarch butterflies reared in captivity. Follow the four- step process as illustrated in Example 17.2. 4 STEP そMP FWweight 30 25 20 15 10 11 12 13 14 15 8 9 10 Summary Statistics Mean 11.795652 Std Dev 1.1759413 Std Err Mean 0.1226004 Upper 95% Mean Lower 95% Mean 1 FIGURE 17.4 Software output (JMP) for the forewing weight of monarch 12.039183 11.552122 92 N. butterflies. Countarrow_forwardIn an experiment to investigate oxide charge, Qax on a silicon wafer. The factors thought to induce oxide charge, Qax are cleaning steps and the test location on the wafer where the charge was measured. The results summarized in Table 5. Table 5 Test Location Oxide Charge, Qox Cleaning Method Right (R) Left (L) (x 10" q/cm?) 1.66 R 1.62 1.90 Complete Spin-Rinse-Dry 1.84 1.92 R 1.84 L. -4.21 R -7.58 -1.35 By pass Rinse Cycle R -2.20 -2.08 R -5.36 Evaluate the significance of each factor using t-test. Show formulas and calculation steps of the statistical analysis method.arrow_forwardA new starch polymer foam with high shock absorbent properties is expected to perform better than the old foam which can withstand a maximum impact of 1.56 Joule (J). A simple destructive test to quantify shock absorption ability of the new foam is conducted. Table 5 shows the impact energy absorbed (in J) that the new foam can withstand for each test. Table 5 1.61 1.5 1.65 1.7 1.4 1.59 1.65 1.5 Does the recorded data suggests that the new foam performs better than the old foam? Use 2.5% level of significance.arrow_forward
- An experiment to compare the tension bond strength of polymer latex modified mortar (Portland cement mortar to which polymer latex emulsions have been added during mixing) to that of unmodified mortar resulted in x = 18.13 kgf/cm? for the modified mortar (m = 42) and y = 16.85 kgf/cm2 for the unmodified mortar (n = 32). Let u, and u, be the true average tension bond strengths for the modified and unmodified mortars, respectively. Assume that the bond strength distributions are both normal. (a) Assuming that o, = 1.6 and o, = 1.3, test Ho: 4, - H, = 0 versus H: u, - µ, > 0 at level 0.01. Calculate the test statistic and determine the P-value. (Round your test statistic to two decimal places and your p-value to four decimal places.) z = 3.80 P-value = 0.0001 State the conclusion in the problem context. O Fail to reject H,. The data suggests that the difference in average tension bond strengths exceeds 0. O Fail to reject Ho: The data does not suggest that the difference in average…arrow_forwardAn experiment to compare the tension bond strength of polymer latex modified mortar (Portland cement mortar to which polymer latex emulsións have been added during mixing) to that of unmodified mortar resulted in x = 18.11 kgf/cm2 for the modified mortar (m = 42) and y = 16.88 kgf/cm2 for the unmodified mortar (n = 31). Let ₁ and ₂ be the true average tension bond strengths for the modified and unmodified mortars, respectively. Assume that the bond strength distributions are both normal. (a) Assuming that o₁ = 1.6 and ₂ = 1.3, test Ho: ₁ - ₂ = 0 versus H₂: H₁ - H₂> 0 at level 0.01. Calculate the test statistic and determine the P-value. (Round your test statistic to two decimal places and your P-value to four decimal places.) Z = P-value = State the conclusion in the problem context. O Fail to reject Ho. The data suggests that the difference in average tension bond strengths exceeds 0. Fail to reject Ho. The data does not suggest that the difference in average tension bond strengths…arrow_forwardAn experiment to compare the tension bond strength of polymer latex modified mortar (Portland cement mortar to which polymer latex emulsions have been added during mixing) to that of unmodified mortar resulted in x = 18.19 kgf/cm? for the modified mortar (m = 42) and y = 16.85 kgf/cm? for the unmodified mortar (n = 30). Let u, and u, be the true average tension bond strengths for the modified and unmodified mortars, respectively. Assume that the bond strength distributions are both normal. Assuming that o, = 1.6 and o, = 1.3, test Hn: 4, - H, = 0 versus H: u, - u, > 0 at level 0.01. Calculate the test statistic and determine the P-value. (Round your test statistic to two decimal places and your P-value to four decimal places.) P-value = Compute the probability of a type II error for the test of part (a) when 4 - Hz = 1. (Round your answer to four decimal places.) Suppose the investigator decided to use a level 0.05 test and vwished B = 0.10 when u, - uz = 1. If m = 42, what value of n…arrow_forward
- An automotive engineer subjects a large number of brake pads to a stress test and measures the wear on each. She obtains Y the P-value for testing Ho: µ = 7.0 versus H1: µ#7.0. = 7.4 mm and or = 0.2 mm, Use this information to findarrow_forwardA group of researchers studied the effect of acid rain on wildlife and collected n = 12 samples from streams in different States. They recorded the pH (X) of the water (i.e. units above pH 7), and the BCI, a measure of biological diversity (Y). The data obtained is summarized below. DATA: Observation 1 2 3 4 5 6 7 8 9 10 11 12 pH above 7 (X) 0.67 0.70 0.93 0.95 1.09 1.01 1.29 1.24 1.41 1.56 1.73 1.80 Units of BCI (Y) 14.4 20.9 16.2 25.0 18.9 19.8 20.7 22.1 23.9 24.9 27.6 29.7 Find the correlation coefficient between pH and BCI (round to the nearest hundredth; place your answer in the box below)arrow_forwardAn experiment was conducted to study the extrusion process of biodegradable packaging foam. Two of the factors considered for their effect on the unit density (mg/ml) were the die temperature (145 °C vs. 155 °C) and the die diameter (3 mm vs. 4 mm). The results are stored in [Packaging Foam 1]. Source: Data extracted from W. Y. Koh, K. M. Eskridge, and M. A. Hanna, "Supersaturated Split-Plot Designs," Journal of Quality Technology, 45, January 2013, pp. 61-72.At the 0.05 level of significance, 3mm 4mm 57.22 145 72.54 145 53.60 66.70 145 48.13 49.28 145 69.89 44.14 145 62.78 58.37 145 55.18 53.98 155 57.50 63.03 155 54.17 46.73 155 73.86 60.17 155 90.28 46.78 155 88.19 43.27 155 82.61 56.93 Die Temperature a. is there an interaction between die temperature and die diameter? b. is there an effect due to die temperature? c. is there an effect due to die diameter? d. Plot the mean unit density for each die temperature for each die diameter. e. What can you conclude about the effect of die…arrow_forward
- Can you use OLS to estimate B the model y; = e? Ytarrow_forwardAn experiment to compare the tension bond strength of polymer latex modified mortar (Portland cement mortar to which polymer latex emulsions have been added during mixing) to that of unmodified mortar resulted in x = 18.18 kgf/cm² for the modified mortar (m = 42) and y = 16.86 kgf/cm² for the unmodified mortar (n = 30). Let µ1 and uz be the true average tension bond strengths for the modified and unmodified mortars, respectively. Assume that the bond strength distributions are both normal. (a) Assuming that o1 = 1.6 and o2 = 1.3, test Ho: H1 - 42 = 0 versus Ha: H1 - H2 > 0 at level 0.01. Calculate the test statistic and determine the P-value. (Round your test statistic to two decimal places and your P-value to four decimal places.) Z = 3.854 P-value = 0.0001 State the conclusion in the problem context. Fail to reject Ho. The data does not suggest that the difference in average tension bond strengths exceeds from 0. Reject Ho. The data does not suggest that the difference in average…arrow_forwardAn experiment to compare the tension bond strength of polymer latex modified mortar (Portland cement mortar to which polymer latex emulsions have been added during mixing) to that of unmodified mortar resulted in x = 18.11 kgf/cm² for the modified mortar (m = 42) and y = 16.82 kgf/cm² for the unmodified mortar (n = 30). Let μ₁ and μ₂ be the true average tension bond strengths for the modified and unmodified mortars, respectively. Assume that the bond strength distributions are both normal. (a) Assuming that ₁ = 1.6 and ₂ = 1.3, test Ho: ₁ - ₂ = 0 versus H₂ : ₁ - ₂ > 0 at level 0.01. Calculate the test statistic and determine the P-value. (Round your test statistic to two decimal places and your P-value to four decimal places.) z = P-value = State the conclusion in the problem context. O Reject Ho. The data does not suggest that the difference in average tension bond strengths exceeds 0. O Fail to reject Ho. The data does not suggest that the difference in average tension bond strengths…arrow_forward
arrow_back_ios
SEE MORE QUESTIONS
arrow_forward_ios
Recommended textbooks for you
 Algebra & Trigonometry with Analytic GeometryAlgebraISBN:9781133382119Author:SwokowskiPublisher:Cengage
Algebra & Trigonometry with Analytic Geometry
Algebra
ISBN:9781133382119
Author:Swokowski
Publisher:Cengage
Type I and II Errors, Power, Effect Size, Significance and Power Analysis in Quantitative Research; Author: NurseKillam;https://www.youtube.com/watch?v=OWn3Ko1WYTA;License: Standard YouTube License, CC-BY