
(a)
Graphical representation of supply and
(a)
Explanation of Solution
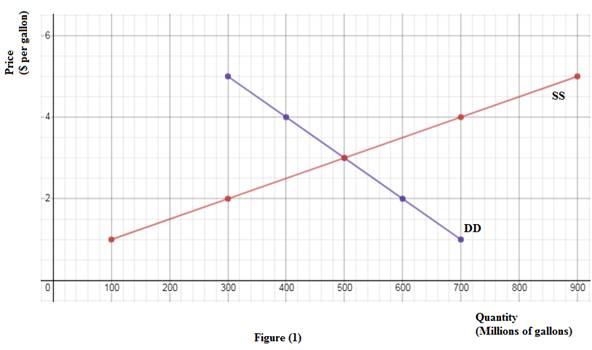
The figure (1) below represents the graphical representation of given demand and supply curves. Here, X- axis measures the quantity (Q) and Y-axis measures price (P).
The downward sloping curve is demand curve (DD) and the upward sloping curve is supply curve (SS).
(b)
Algebraic equation of supply and demand curves.
(b)
Explanation of Solution
As shown in figure (1) above, the given points lie along two straight lines.
Use following point slope formula to calculate algebraic equation:
To calculate algebraic equation of demand curve, plug (700,1) and (600,2) in (1).
To calculate algebraic equation of supply curve, plug (100,1) and (300,2) in (1).
Thus, equations of demand (QD) and supply (QS) curves are as follows:
(c)
Excess demand of the good if the market price is zero.
(c)
Explanation of Solution
Excess demand refers to a situation where market demand is more than market supply at the given market price. It can be calculated by subtracting market demand from market supply.
(d)
(d)
Explanation of Solution
Excess supply refers to a situation where market supply is more than market demand at the given market price. It can be calculated by subtracting market supply from market demand.
Want to see more full solutions like this?
Chapter 1 Solutions
EBK INTERMEDIATE MICROECONOMICS AND ITS

- a. Graph the points of these supply and demand curves for orange juice. Be sure to put price on the vertical axis and quantity on the horizontal axis. b. Do these points seem to lie along two straight lines? If so, figure out the precise algebraic equation of these lines. (Hint: If the points do lie on straight lines, you need only consider two points on each of them to calculate the lines.) c. Use your solutions from part b to calculate the "excess demand" for orange juice if the market price is zero. d. Use your solutions from part b to calculate the "excess supply" of orange juice if the orange juice price is $6 per gallon.arrow_forwardThis problem involves solving demand and supply equations together to determine price and quantity. a. Consider a demand curve of the form QD=-2P+20, where QD is the quantity demanded of a good and P is the price of the good. Graph this demand curve. Also draw a graph of the supply curve Qs =2P-4, where Qs is the quantity supplied. Be sure to put P on the vertical axis and Q on the horizontal axis. Assume that all the Qs and Ps are nonnegative for parts a, b, and c. At what values of P and Q do these curves intersect-that is, where does QD = Qs ? b. Now, suppose at each price that individuals demand four more units of output-that the demand curve shifts to QD - 2P+24. Graph this new demand curve. At what values of P and Q does the new demand curve intersect the old supply curve-that is, where does QD = Qs ? c. Now finally, suppose the supply curve shifts to Q's=2P-8. Graph this new supply curve. At what values of P and Q does QD=Q's? Show all working calculations and label garph with…arrow_forwardThe following graph plots the market for electric guitars in Houston, where there are always over 1,000 music stores. Suppose the price of acoustic guitars decreases. (Assume that people regard electric guitars and acoustic guitars as substitutes.) Show the effect of this change on the market for electric guitars by shifting one or both of the curves on the following graph, holding all else constant. Note: Select and drag one or both of the curves to the desired position. Curves will snap into position, so if you try to move a curve and it snaps back to its original position, just drag it a little farther. PRICE (Dollars per guitar) Supply Demand Demand 1 Supplyarrow_forward
- The following graph shows the market for croissants in Philadelphia, where there are over 1,000 bakeries at any given moment. Suppose croissant sellers expect that tomorrow the price of croissant will be significantly higher than today's price. Show the effect of this change on the market for croissants by shifting one or both of the curves on the following graph, holding all else constant. Note: Select and drag one or both of the curves to the desired position. Curves will snap into position, so if you try to move a curve and it snaps back to its original position, just drag it a little farther. PRICE (Dollars per croissant) QUANTITY (Croissants) Supply Demand Demand Supply (?)arrow_forwardSuppose both the demand for olives and the supply of olives decline by equal amounts over some time period. Use graphical analysis to show the effect on equilibrium price and quantity. Instructions: On the graph below, use your mouse to click and drag the supply and demand curves as necessary. Price of olives Quantity of olives S₁ Oarrow_forwardNext, graphically illustrate the supply curve and demand curve for eggs, being certain that you fully label the graph; Then, briefly distinguish the difference between a movement along a curve and a shift of the curve. In doing so, be certain to list in your answer the factors shifting the demand curve as well as the factors shifting the supply curve; Next, graphically illustrate simultaneous shifts of the demand and supply curves for eggs, where there is a small rightward shift of the supply curve and a larger leftward shift of the demand curve, being certain that you fully label the graph. In doing so, be certain your answer includes an explanation of what happens to the equilibrium price and equilibrium quantity of eggs as a result of the shifts and what could have caused the supply curve to shift rightward and what could have caused the demand curve to shift leftward;arrow_forward
- The diagram to the right illustrates a hypothetical demand curve representing the relationship between price (in dollars per unit) and quantity (in 1,000s of units per unit of time). The area of the triangle shown on the diagram is $ (Enter your response as an integer.) C Price (dollars per unit) 100- 90- 80- 70- 60- 50- 40- 30- 20- 10- 0- 65 31 0 :25 :59 T 10 20 30 40 50 60 70 80 Quantity (1,000s of units per unit of time) 90 100 o Uarrow_forwardThe demand for coffee is given by the following equation, where QD�� stands for the quantity demanded and P stands for price. QD=100−4PQD= 100- 4P The supply of coffee is given by the following equation, where QS�� stands for the quantity supplied and P stands for price. QS=-10+2PQS= -10+ 2P For parts a-d, consider a graph of the demand and supply curves with price on the vertical axis and quantity on the horizontal axis. What is the slope of demand? Slope = At what price is quantity demanded equal to zero (this is, graphically, the vertical intercept of Demand)? P = What is the slope of supply? Slope = At what price is quantity supplied equal to zero (this is, graphically, the vertical intercept of Supply)? P =arrow_forward1. A) Suppose that the demand for milk increases because a new beauty treatment is discovered that uses milk. Analyze the effects of this change on the equilibrium for milk and the equilibrium for cookies by thinking about the diagrams. B) Now to convince yourself that your graphical answer is right, consider the following supply and demand equations for milk and cookies. Qd M = 40 – 2PM – PC Qd C = 40 – 2PC – PM Qs M = PM Qs C = PC i) Solve for the equilibrium prices and quantities. ii) Now suppose that the demand for milk increases so that the demand for milk is given by Qd M= 80 – 2PM – PC. Solve for the new equilibrium prices and quantities of milk and cookies.arrow_forward
- In the aftermath of the devastating hurricane Sandy in the Northeast and Jersey Shore, prices of certain goods had risen dramatically. Some people had objected to these price increases, and called for the government to forbid sellers from charging such high prices. This exercise asks you to apply economic principles in explaining why prices tend to rise, and what consequences would result from forbidding sellers from raising prices. We will consider the case of bottled fresh water being available for sale in supermarkets. Draw a graph showing the equilibrium price for the pre-hurricane demand for and supply of bottled water that currently existed in the market place. (label the current equilibrium price as p1 on the price axis, and the quantity as q1 on the quantity axisarrow_forwardes The graph below shows the market for oats. Price per bushel 12 11 10 9 8 10 432 S 4 0 10 50 70 100¹10120 30 90 80 60 40 20 Quantity per period (in millions of bushels) S Tools Sz Prev 4 of 8 # Next >arrow_forwardConsider the market for pens. Suppose that new medical concerns regarding graphite absorption have put pressure on schools to reduce pencil use in favor of pens. Further, the price of plastic, a major input in the pen production process, has dropped sharply. On the following graph, labeled Scenario 1, indicate the effect these two events have on the demand for and supply of pens. Note: Select and drag one or both of the curves to the desired position. Curves will snap into position, so if you try to move a curve and it snaps back to its original position, just drag it a little farther. PRICE (Dollars per pen) 10 Supply 8 7 X Demand 5 6 7 8 9 10 2 3 QUANTITY (Millions of pens) 9 1 0 10 Scenario 1 0 1 Scenario 2 9 Supply 8 7 X Demand 2 0 1 2 3 4 5 6 7 8 9 10 QUANTITY (Millions of pens) 1 0 Next, complete the following graph, labeled Scenario 2, by shifting the supply and demand curves in the same way that you did on the Scenario 1 graph. Demand 0 Supply Demand Supply ?arrow_forward
 Exploring EconomicsEconomicsISBN:9781544336329Author:Robert L. SextonPublisher:SAGE Publications, Inc