Financial Accounting (12th Edition) (What's New in Accounting)
12th Edition
ISBN: 9780134725987
Author: C. William Thomas, Wendy M. Tietz, Walter T. Harrison Jr.
Publisher: PEARSON
expand_more
expand_more
format_list_bulleted
Concept explainers
Videos
Textbook Question
Chapter 10, Problem 10.17S
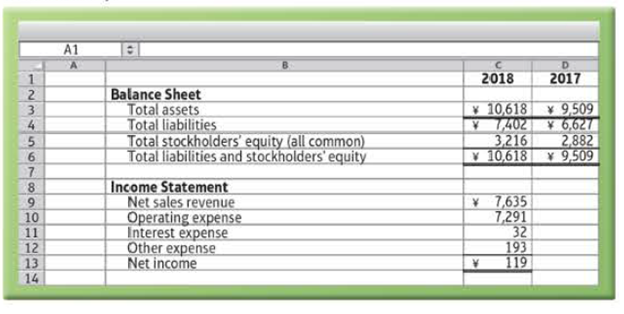
(Learning Objective 5: Calculate return on assets and return on equity for a leading company) Toyama Corporation’s 2018 financial statements reported the following information, with 2017 figures shown for comparison (adapted, and in millions):
Expert Solution & Answer
Want to see the full answer?
Check out a sample textbook solution
Students have asked these similar questions
(Learning Objective 7: Calculate return on assets) Handley Grocery Corporationreported the following information in its comparative financial statements for the fiscal yearended January 31, 2018:January 31,2018January 31,2017Net sales....................................Net earnings..............................Average total assets...................$50,000$ 2,200$40,000$48,350$ 2,100$39,300Requirements1. Compute the net profit margin ratio for the years ended January 31, 2018, and 2017. Did itimprove or worsen in 2018?2. Compute asset turnover for the years ended January 31, 2018, and 2017. Did it improve orworsen in 2018?3. Compute return on assets for the years ended January 31, 2018, and 2017. Did it improveor worsen in 2018? Which component—net profit margin ratio or asset turnover—wasmostly responsible for the change in the company’s return on assets?
(Learning Objective 7: Calculate return on assets) Hometown Supply Companyreported the following information in its comparative financial statements for the fiscal yearended January 31, 2018:January 31,2018January 31,2017Net sales....................................Net earnings..............................Average total assets...................$84,000$ 4,200$70,000$82,600$ 4,050$69,450Requirements1. Compute the net profit margin ratio for the years ended January 31, 2018, and 2017. Did itimprove or worsen in 2018?2. Compute asset turnover for the years ended January 31, 2018, and 2017. Did it improve orworsen in 2018?3. Compute return on assets for the years ended January 31, 2018, and 2017. Did it improveor worsen in 2018? Which component—net profit margin ratio or asset turnover—wasmostly responsible for the change in the company’s return on assets?
OBJECTIVE: To enable learners to utilize financial ratios as a mechanism to evaluate the firm's financial
performance and identify areas for making decisions for improvement
REQUIREMENT: Financial Statement Analysis
Question
Refer to the following financial statements of Delima Corporation for 2019 and 2020:
Delima Corporation
Income Statements
For the year ended 31 December (in millions)
2020
$13,198
7,750
2019
$12,397
7,108
Net sales
Cost of goods sold
Gross profit
Selling and administrative expenses
Income from operations
5,448
5,289
3,472
3,299
1,976
1,990
Interest expense
233
248
Other (income) expense, net
11
1,732
503
1,229
Income before income taxes
1,742
Income tax expense
502
Net income
1,240
Delima Corporation
Balance Sheets
31 December (in millions)
2020
2019
Assets
Current assets
Cash
$460
$444
Accounts receivables (net)
1,188
1,132
1,190
1,056
225
2,915
3,128
Inventories
Other current assets
247
Total current assets
3,027
3,281
Property (net)
5,593
$11,901
Other assets…
Chapter 10 Solutions
Financial Accounting (12th Edition) (What's New in Accounting)
Ch. 10 - The two main categories of stockholders equity are...Ch. 10 - Prob. 2QCCh. 10 - Stockholders of a corporation directly elect the...Ch. 10 - The par value of a share of common stock a. is...Ch. 10 - Prob. 5QCCh. 10 - If a corporation issues 1,000 shares of 1 par...Ch. 10 - Prob. 7QCCh. 10 - Sandusky Corporation purchased 3,000 shares of its...Ch. 10 - Graves Corporation issued 50,000 shares of 1 par...Ch. 10 - Prob. 10QC
Ch. 10 - For cash dividends, the journal entry on the date...Ch. 10 - Prob. 12QCCh. 10 - Prob. 13QCCh. 10 - Prob. 14QCCh. 10 - Prob. 15QCCh. 10 - Prob. 16QCCh. 10 - Prob. 10.1ECCh. 10 - Prob. 10.1SCh. 10 - (Learning Objective 1: Describe characteristics of...Ch. 10 - Prob. 10.3SCh. 10 - Prob. 10.4SCh. 10 - (Learning Objective 2: Record issuance of stock...Ch. 10 - Prob. 10.6SCh. 10 - Prob. 10.7SCh. 10 - Prob. 10.8SCh. 10 - Prob. 10.9SCh. 10 - Prob. 10.10SCh. 10 - (Learning Objective 4: Divide cash dividends...Ch. 10 - Prob. 10.12SCh. 10 - (Learning Objective 6: Prepare the stockholders...Ch. 10 - (Learning Objective 5: Use stockholders equity...Ch. 10 - (Learning Objective 5: Calculate book value per...Ch. 10 - (Learning Objective 5: Calculate and explain...Ch. 10 - (Learning Objective 5: Calculate return on assets...Ch. 10 - Prob. 10.18SCh. 10 - (Learning Objective 2. 5: Define and use various...Ch. 10 - Prob. 10.20SCh. 10 - Prob. 10.21SCh. 10 - Prob. 10.22SCh. 10 - (Learning Objective 1: Identify key terms...Ch. 10 - (Learning Objectives 2, 6: Account for issuance of...Ch. 10 - Prob. 10.25AECh. 10 - Prob. 10.26AECh. 10 - Prob. 10.27AECh. 10 - (Learning Objective 3: Account for the purchase...Ch. 10 - (Learning Objectives 2, 3, 4: Account for issuance...Ch. 10 - (Learning Objective 6: Report stockholders equity...Ch. 10 - Prob. 10.31AECh. 10 - LO 4 (Learning Objective 4: Calculate dividends on...Ch. 10 - Prob. 10.33AECh. 10 - Prob. 10.34AECh. 10 - LO 5 (Learning Objective 5: Calculate and...Ch. 10 - LO 4,6 (Learning Objective 4, 6: Analyze...Ch. 10 - (Learning Objective 5: Evaluate profitability)...Ch. 10 - Prob. 10.38AECh. 10 - LO 6 (Learning Objective 6: Use a companys...Ch. 10 - (Learning Objective 1: Identify key terms...Ch. 10 - (Learning Objectives 2, 6: Account for issuance of...Ch. 10 - Prob. 10.42BECh. 10 - Prob. 10.43BECh. 10 - (Learning Objectives 3, 6: Show how treasury stock...Ch. 10 - (Learning Objective 3: Account for the purchase...Ch. 10 - (Learning Objectives 2, 3, 4: Account for issuance...Ch. 10 - Prob. 10.47BECh. 10 - Prob. 10.48BECh. 10 - Prob. 10.49BECh. 10 - Prob. 10.50BECh. 10 - (Learning Objectives 2, 3, 4: Measure the effect s...Ch. 10 - Prob. 10.52BECh. 10 - (Learning Objective 5: Analyze alternative plans...Ch. 10 - (Learning Objective 5: Evaluate profitability)...Ch. 10 - Prob. 10.55BECh. 10 - Prob. 10.56BECh. 10 - Prob. 10.57QCh. 10 - Prob. 10.58QCh. 10 - Prob. 10.59QCh. 10 - Prob. 10.60QCh. 10 - Prob. 10.61QCh. 10 - Prob. 10.62QCh. 10 - Prob. 10.63QCh. 10 - Prob. 10.64QCh. 10 - Quill Corporation paid 28 per share to purchase...Ch. 10 - Prob. 10.66QCh. 10 - Prob. 10.67QCh. 10 - Prob. 10.68QCh. 10 - Prob. 10.69QCh. 10 - Prob. 10.70QCh. 10 - Prob. 10.71QCh. 10 - Prob. 10.72QCh. 10 - Prob. 10.73QCh. 10 - Prob. 10.74QCh. 10 - Prob. 10.75QCh. 10 - Prob. 10.76APCh. 10 - (Learning Objective 6: Report stockholders equity)...Ch. 10 - (Learning Objectives 2, 4: Analyze stockholders...Ch. 10 - (Learning Objectives 2, 3, 4: Account for stock...Ch. 10 - Prob. 10.80APCh. 10 - Prob. 10.81APCh. 10 - Prob. 10.82APCh. 10 - Prob. 10.83APCh. 10 - Prob. 10.84BPCh. 10 - Prob. 10.85BPCh. 10 - (Learning Objectives 2, 4: Analyze stockholders...Ch. 10 - (Learning Objectives 2, 3, 4: Account for stock...Ch. 10 - Prob. 10.88BPCh. 10 - Prob. 10.89BPCh. 10 - (Learning Objective 5: Differentiate financing...Ch. 10 - Prob. 10.91BPCh. 10 - Prob. 10.92CEPCh. 10 - Prob. 10.93CEPCh. 10 - Prob. 10.94CEPCh. 10 - Prob. 10.95CEPCh. 10 - (Learning Objectives 2, 3, 4, 6: Analyze...Ch. 10 - (Learning Objectives 2, 3, 4: Calculate impact of...Ch. 10 - Prob. 10.98DCCh. 10 - Prob. 10.99DCCh. 10 - Prob. 10.100EICCh. 10 - Prob. 10.101EICCh. 10 - (Learning Objectives 2, 3, 4, 5: Analyze common...Ch. 10 - (Learning Objectives 2, 3, 4: Analyze treasury...
Knowledge Booster


Learn more about
Need a deep-dive on the concept behind this application? Look no further. Learn more about this topic, accounting and related others by exploring similar questions and additional content below.Similar questions
- E12-24B Vertical analysis (Learning Objective 2) 15-20 min. Simpson Painting, Inc., requested that you perform a vertical analysis of its balance sheet to determine the component percentages of its assets, liabilities, and stockholders' equity. Round to the nearest tenth of a percent. P. Donnelly, Inc. Comparative Income Statement Years Ended December 31, 2018 and 2017 Revenue Expenses: Cost of Goods Sold Selling and General Expenses Interest Expense Income Tax Expense Total Expenses Net Income 2018 $500,000 $245,000 111,000 10,000 54,700 420,700 $ 79,300 2017 $439,500 $236,000 103,500 6,500 44,400 390,400 $ 49,100arrow_forwardS15-7 Computing rate of return on total assets Godhi's 2014 financial statements reported the following items-with 2013 figures given for comparison: Learning GODHI, INC. Balance Sheet As of December 31, 2014 and 2013 2014 2013 $ 33,538 $ 29,562 Total Assets 17,100 14,962 Total Liabilities Total Stockholders' Equity (all common) 16,438 14,600 $ 33,538 $ 29,562 Total Liabilities and Stockholders' Equity Net income for 2014 was $3,890 and interest expense was $210. Compute Godhi's rate of return on total assets for 2014. (Round to the nearest percent.)arrow_forward(Learning Objective 7: Evaluate liquidity using the quick [acid-test] ratio and days’sales in receivables) Northern Products reported the following amounts in its 2019 financialstatements. The 2018 amounts are given for comparison.2019 2018Current assets:Cash............................................ $ 9,500Short-term investments................ 7,000Accounts receivable..................... $70,100Less: Allowance foruncollectibles.......................$86,500(7,500) (5,500) 64,600Inventory..................................... 190,000Prepaid insurance ........................ 2,200Total current assets..................... 273,300Total current liabilities.................... 106,000Net sales (all on account) ................$ 9,50010,50079,000189,0002,200290,20099,0001,077,000 734,000Requirements1. Compute Northern’s quick (acid-test) ratio at the end of 2019. Round to two decimalplaces. How does the quick ratio compare with the industry average of 0.92?2. Compare days’ sales…arrow_forward
- Some selected financial statement items belonging to PXR Company are given in the table below. According to this information, which of the following is Return on Assets (ROA) in 2021? Receivables 18,500 Total Assets in 2021 130,000 Current Liabilities 42,000 Total Assets in 2020 110,000 Net Profit 18,000 Shareholders' Equity 85,000 Select one: a. 0.11 b. 0.18 c. 0.21 d. 0.18 Clear my choicearrow_forwardSome selected financial statement items belonging to PXR Company are given in the table below. According to this information, which of the following is Return on Assets (ROA) in 2021? Receivables 18,500 Total Assets in 2021 130,000 Current Liabilities 42,000 Total Assets in 2020 110,000 Net Profit 18,000 Shareholders' Equity 85,000 Select one: a. 0.18 b. 0.11 c. 0.21 d. 0.18arrow_forward(Learning Objective 2: Analyze accounts payable turnover) Barnacle Sales, Inc.’s,comparative income statements and balance sheets show the following selected information for2017 and 2018:2018$2,850,000$ 800,000$ 600,000$ 305,0002017$2,700,000$ 600,000$ 400,000$ 255,000Cost of goods sold.......................................................Ending inventory.........................................................Beginning inventory ....................................................Average accounts payable ...........................................Requirements1. Calculate the company’s accounts payable turnover and days’ payable outstanding (DPO)for 2017 and 2018.2. On the basis of this computation alone, has the company’s liquidity position improved ordeteriorated during 2018?arrow_forward
- Some selected financial statement items belonging to MNO Company are given in the table below. According to this information, which of the following is Return on Assets (ROA) in 2021? Inventory 12,500Total Assets in 2021 110,000Current Liabilities 40,000Total Assets in 2020 90,000Net Profit 12,000Shareholders' Equity 65,000 Select one:a. 0.12b. 0.10c. 0.18d. 0.13arrow_forwardE1-23A. (Learning Objective 4: Identify financial statement by type of information) ButlerTech, Inc., is expanding into India. The company must decide where to locate and how tofinance the expansion. Identify the financial statement where these decision makers can findthe following information about Butler Tech, Inc. In some cases, more than one statement willreport the needed data.a. Revenueb. Common stockc. Current liabilitiesd. Long-term debte. Dividendsf. Ending cash balanceg. Adjustments to reconcile net income tonet cash provided by operationsh. Cash spent to acquire the buildingi. Income tax expensej. Ending balance of retained earningsk. Selling, general, and administrativeexpensel. Total assetsm. Net incomen. Income tax payablearrow_forwardAnalyze the financial statements of the company to you in terms of: 1. Profitability Ratio: *Operating Margin *Return on Total Assets *Return on Common Equity. *Return on Invested Capital *Basic Earnings Power Ratio2020 Analysis BUT also compare with 2018 - 2019. Show solution on computaion.arrow_forward
- Help me pleasearrow_forwardUsing the fiscal year end 2020 annual report for General Mills, Inc. and the figures from the 2020 annual report as noted below, calculate the financial ratios for 2020 and 2019 indicated using the EXCEL template provided:1. Gross profit percentage2. Return on sales3. Asset turnover 4. Return on assets5. Return on common stockholders’ equity6. Current ratio7. Quick ratio8. Operating-cash-flow-to-current-liabilities ratio9. Accounts receivable turnoverTotal assets 2020 = $30,806.7Total stockholders’ equity 2020 = $8,349.5Total current liabilities 2020 = $7,491.5Accounts receivable 2020 = $1,615.1Inventory 2020 = $1,426.3Year-end closing stock price May 2020 = $58.80Year-end closing stock price May 2019 = $53.56 To calculate averages use (current year balance + poor year balance) / 2) Round percentages to 1 decimal place; round other answers to 2 decimal places.arrow_forwardAnalyze the financial statements of the company to you in terms of:1. Solvency Ratio: *Equity Ratio 2. Asset Management Ratio: *Invetory Turnover Ratio *Fixed Asset Turnover Ratio *Total Asset Turnover Ratio 3. Debt Management Ratio: *Time Interest Earned Ratio 4. Profitability Ratio: *Operating Margin *Return on Total Assets *Return on Common Equity.…arrow_forward
arrow_back_ios
arrow_forward_ios
Recommended textbooks for you

 AccountingAccountingISBN:9781337272094Author:WARREN, Carl S., Reeve, James M., Duchac, Jonathan E.Publisher:Cengage Learning,
 Accounting Information SystemsAccountingISBN:9781337619202Author:Hall, James A.Publisher:Cengage Learning,
 Horngren's Cost Accounting: A Managerial Emphasis...AccountingISBN:9780134475585Author:Srikant M. Datar, Madhav V. RajanPublisher:PEARSON
 Intermediate AccountingAccountingISBN:9781259722660Author:J. David Spiceland, Mark W. Nelson, Wayne M ThomasPublisher:McGraw-Hill Education
 Financial and Managerial AccountingAccountingISBN:9781259726705Author:John J Wild, Ken W. Shaw, Barbara Chiappetta Fundamental Accounting PrinciplesPublisher:McGraw-Hill Education
Accounting
Accounting
ISBN:9781337272094
Author:WARREN, Carl S., Reeve, James M., Duchac, Jonathan E.
Publisher:Cengage Learning,
Accounting Information Systems
Accounting
ISBN:9781337619202
Author:Hall, James A.
Publisher:Cengage Learning,
Horngren's Cost Accounting: A Managerial Emphasis...
Accounting
ISBN:9780134475585
Author:Srikant M. Datar, Madhav V. Rajan
Publisher:PEARSON
Intermediate Accounting
Accounting
ISBN:9781259722660
Author:J. David Spiceland, Mark W. Nelson, Wayne M Thomas
Publisher:McGraw-Hill Education
Financial and Managerial Accounting
Accounting
ISBN:9781259726705
Author:John J Wild, Ken W. Shaw, Barbara Chiappetta Fundamental Accounting Principles
Publisher:McGraw-Hill Education
The KEY to Understanding Financial Statements; Author: Accounting Stuff;https://www.youtube.com/watch?v=_F6a0ddbjtI;License: Standard Youtube License