
Concept explainers
Videos
(a)
To graph: A
(a)
Explanation of Solution
Given: The data for the average debt, percentage of students who borrow, admittance rate, four-year graduation rate, in-state tuition after aid, out-of-state tuition after aid, average aid per student and the number of students per faculty member 40 colleges in US.
| College | Admit | Yr4Grad | StudPerFac | InAfterAid | OutAfterAid | AvgAid | PercBorrow | AvgDebt |
| The University of Arizona, Tucson | 75 | 34 | 20 | 9565 | 25775 | 9261 | 44 | 20074 |
| Stony Brook University, State University of New York, Stony Brook | 41 | 43 | 19 | 11193 | 20643 | 7275 | 59 | 19807 |
| University of Illinois at Springfield, Springfield | 59 | 50 | 14 | 11489 | 20639 | 8213 | 61 | 17335 |
| State University of New York College at Oneonta, Oneonta | 41 | 48 | 17 | 12649 | 21699 | 5311 | 75 | 17564 |
| Iowa State University of Science and Technology, Ames | 81 | 37 | 17 | 9738 | 21610 | 6413 | 69 | 30062 |
| University of South Florida, Tampa | 45 | 24 | 28 | 10598 | 19788 | 5966 | 52 | 21679 |
| University of New Hampshire, Durham | 73 | 61 | 18 | 21947 | 35267 | 3955 | 76 | 35671 |
| University of North Florida, Jacksonville | 51 | 20 | 21 | 9171 | 21922 | 5789 | 39 | 15300 |
| University of South Carolina, Columbia | 70 | 46 | 19 | 14117 | 30301 | 5027 | 49 | 21811 |
| State University of New York College at Brockport, Brockport | 42 | 42 | 18 | 12888 | 21938 | 5140 | 80 | 25733 |
| The University of North Carolina at Chapel Hill, Chapel Hill | 32 | 76 | 14 | 6548 | 26374 | 11080 | 31 | 16165 |
| Towson University, Towson | 57 | 40 | 17 | 11627 | 23139 | 7601 | 56 | 19069 |
| University of California, Santa Barbara, Santa Barbara | 46 | 64 | 17 | 12711 | 34521 | 15389 | 47 | 17596 |
| St. Mary's College of Maryland, St. Mary's City | 65 | 74 | 12 | 17696 | 29773 | 8664 | 70 | 17505 |
| University of Georgia, Athens | 59 | 54 | 19 | 10288 | 28498 | 8970 | 45 | 15938 |
| Christopher Newport University, Newport News | 60 | 42 | 17 | 15725 | 24947 | 5087 | 51 | 21572 |
| The Ohio State University, Columbus | 68 | 49 | 19 | 12680 | 27575 | 7789 | 59 | 22830 |
| University of Delaware, Newark | 54 | 62 | 12 | 15728 | 31998 | 6734 | 44 | 17200 |
| California State Polytechnic University, Pomona, Pomona | 45 | 20 | 26 | 10701 | 21861 | 8280 | 35 | 16704 |
| University of Illinois at Urbana–Champaign, Champaign | 67 | 67 | 16 | 14809 | 28951 | 10885 | 51 | 21543 |
| Auburn University, Auburn University | 79 | 36 | 18 | 13057 | 27649 | 6733 | 46 | 24777 |
| The University of Alabama, Tuscaloosa | 54 | 38 | 19 | 11584 | 24884 | 6680 | 53 | 26701 |
| University of Wisconsin–Madison, Madison | 58 | 51 | 17 | 12733 | 28483 | 5857 | 48 | 22837 |
| The University of Texas at Dallas, Richardson | 50 | 42 | 19 | 14068 | 31094 | 6664 | 41 | 17384 |
| State University of New York at Binghamton, Binghamton | 40 | 66 | 21 | 13310 | 21420 | 6716 | 50 | 21110 |
| Rutgers, The State University of New Jersey, New Brunswick/Piscataway, Piscataway | 59 | 53 | 15 | 15629 | 28291 | 9937 | 68 | 16766 |
| University of Science and Arts of Oklahoma, Chickasha | 56 | 18 | 14 | 4132 | 11092 | 7098 | 29 | 15339 |
| Miami University, Oxford | 79 | 68 | 17 | 19310 | 34482 | 6083 | 51 | 27315 |
| University of Maryland, College Park, College Park | 44 | 63 | 18 | 12450 | 29821 | 6959 | 43 | 22696 |
| New College of Florida, Sarasota | 53 | 57 | 10 | 5316 | 28345 | 10142 | 36 | 11458 |
| The University of North Carolina at Asheville, Asheville | 77 | 30 | 14 | 7443 | 21075 | 6202 | 48 | 15443 |
| University of Mary Washington, Fredericksburg | 77 | 68 | 15 | 12206 | 23934 | 6500 | 57 | 15600 |
| University of California, Los Angeles, Los Angeles | 23 | 68 | 17 | 15397 | 38275 | 12777 | 45 | 16733 |
| University of Virginia, Charlottesville | 33 | 85 | 16 | 5138 | 29460 | 16488 | 32 | 19384 |
| University of California, Berkeley, Berkeley | 22 | 69 | 17 | 13164 | 36042 | 15863 | 41 | 16056 |
| University of Oklahoma, Norman | 85 | 33 | 18 | 11417 | 22370 | 6011 | 52 | 21517 |
| The University of North Carolina at Wilmington, Wilmington | 57 | 45 | 17 | 7367 | 19188 | 6792 | 25 | 19277 |
| University of Connecticut, Storrs | 54 | 66 | 18 | 14403 | 31299 | 8167 | 63 | 23237 |
| University of Michigan, Ann Arbor | 51 | 72 | 15 | 13170 | 38842 | 10783 | 46 | 27828 |
| University of Colorado at Boulder, Boulder | 83 | 41 | 18 | 14549 | 35727 | 7873 | 43 | 19758 |
Graph: To draw the scattered plot of each explanatory variable with AvgDebt of the provided data, below mentioned steps are followed in Minitab.
Step 1: Enter the data into Minitab worksheet.
Step 2: Go to Graph, select Matrix Plot, select Each Y versus each X and select Simple.
Step 3: Select AvgDebt as Y variable and Admit, Yr4Grad, StudPerFac, InAfterAid, OutAfterAid, AvgAid, PercBorrow.
Step 4: Press “OK”.
The obtained scattered plot is as follows:
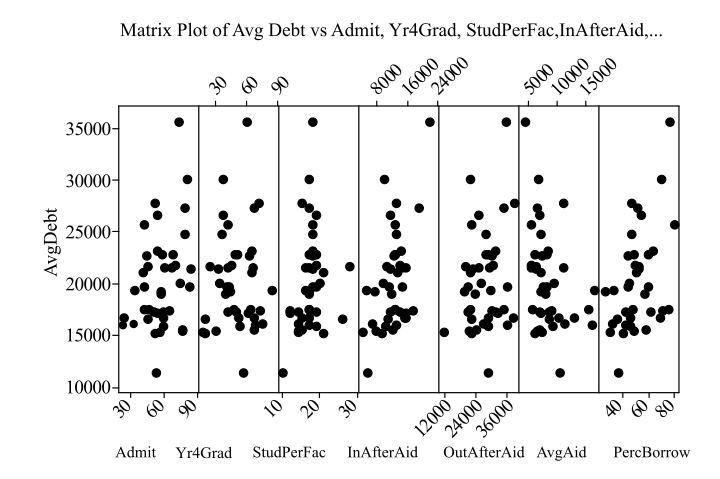
Interpretation: The obtained scattered plot shows that the relationship between AvgDebt and AvgAid is negative linear while with all other variable it is positively linear.
(b)
To find: The Curves which fit the each of the predictors separately and to create a table which lists the explanatory variable, model standard deviation
(b)
Answer to Problem 14E
Solution: The table that shows the models for each explanatory variable, model standard deviation
| Explanatory variable | Model | Model standard deviation s | P-value |
| Admit, | |||
| Yr4Grad | |||
| StudPerFac | |||
| InAfterAid | |||
| OutAfterAid | |||
| AvgAid | |||
| PercBorrow |
Explanation of Solution
Given: The data for the average debt, percentage of students who borrow, admittance rate, four-year graduation rate, in-state tuition after aid, out-of-state tuition after aid, average aid per student and the number of students per faculty member 40 colleges in US.
| College | Admit | Yr4Grad | StudPerFac | InAfterAid | OutAfterAid | AvgAid | PercBorrow | AvgDebt |
| The University of Arizona, Tucson | 75 | 34 | 20 | 9565 | 25775 | 9261 | 44 | 20074 |
| Stony Brook University, State University of New York, Stony Brook | 41 | 43 | 19 | 11193 | 20643 | 7275 | 59 | 19807 |
| University of Illinois at Springfield, Springfield | 59 | 50 | 14 | 11489 | 20639 | 8213 | 61 | 17335 |
| State University of New York College at Oneonta, Oneonta | 41 | 48 | 17 | 12649 | 21699 | 5311 | 75 | 17564 |
| Iowa State University of Science and Technology, Ames | 81 | 37 | 17 | 9738 | 21610 | 6413 | 69 | 30062 |
| University of South Florida, Tampa | 45 | 24 | 28 | 10598 | 19788 | 5966 | 52 | 21679 |
| University of New Hampshire, Durham | 73 | 61 | 18 | 21947 | 35267 | 3955 | 76 | 35671 |
| University of North Florida, Jacksonville | 51 | 20 | 21 | 9171 | 21922 | 5789 | 39 | 15300 |
| University of South Carolina, Columbia | 70 | 46 | 19 | 14117 | 30301 | 5027 | 49 | 21811 |
| State University of New York College at Brockport, Brockport | 42 | 42 | 18 | 12888 | 21938 | 5140 | 80 | 25733 |
| The University of North Carolina at Chapel Hill, Chapel Hill | 32 | 76 | 14 | 6548 | 26374 | 11080 | 31 | 16165 |
| Towson University, Towson | 57 | 40 | 17 | 11627 | 23139 | 7601 | 56 | 19069 |
| University of California, Santa Barbara, Santa Barbara | 46 | 64 | 17 | 12711 | 34521 | 15389 | 47 | 17596 |
| St. Mary's College of Maryland, St. Mary's City | 65 | 74 | 12 | 17696 | 29773 | 8664 | 70 | 17505 |
| University of Georgia, Athens | 59 | 54 | 19 | 10288 | 28498 | 8970 | 45 | 15938 |
| Christopher Newport University, Newport News | 60 | 42 | 17 | 15725 | 24947 | 5087 | 51 | 21572 |
| The Ohio State University, Columbus | 68 | 49 | 19 | 12680 | 27575 | 7789 | 59 | 22830 |
| University of Delaware, Newark | 54 | 62 | 12 | 15728 | 31998 | 6734 | 44 | 17200 |
| California State Polytechnic University, Pomona, Pomona | 45 | 20 | 26 | 10701 | 21861 | 8280 | 35 | 16704 |
| University of Illinois at Urbana–Champaign, Champaign | 67 | 67 | 16 | 14809 | 28951 | 10885 | 51 | 21543 |
| Auburn University, Auburn University | 79 | 36 | 18 | 13057 | 27649 | 6733 | 46 | 24777 |
| The University of Alabama, Tuscaloosa | 54 | 38 | 19 | 11584 | 24884 | 6680 | 53 | 26701 |
| University of Wisconsin–Madison, Madison | 58 | 51 | 17 | 12733 | 28483 | 5857 | 48 | 22837 |
| The University of Texas at Dallas, Richardson | 50 | 42 | 19 | 14068 | 31094 | 6664 | 41 | 17384 |
| State University of New York at Binghamton, Binghamton | 40 | 66 | 21 | 13310 | 21420 | 6716 | 50 | 21110 |
| Rutgers, The State University of New Jersey, New Brunswick/Piscataway, Piscataway | 59 | 53 | 15 | 15629 | 28291 | 9937 | 68 | 16766 |
| University of Science and Arts of Oklahoma, Chickasha | 56 | 18 | 14 | 4132 | 11092 | 7098 | 29 | 15339 |
| Miami University, Oxford | 79 | 68 | 17 | 19310 | 34482 | 6083 | 51 | 27315 |
| University of Maryland, College Park, College Park | 44 | 63 | 18 | 12450 | 29821 | 6959 | 43 | 22696 |
| New College of Florida, Sarasota | 53 | 57 | 10 | 5316 | 28345 | 10142 | 36 | 11458 |
| The University of North Carolina at Asheville, Asheville | 77 | 30 | 14 | 7443 | 21075 | 6202 | 48 | 15443 |
| University of Mary Washington, Fredericksburg | 77 | 68 | 15 | 12206 | 23934 | 6500 | 57 | 15600 |
| University of California, Los Angeles, Los Angeles | 23 | 68 | 17 | 15397 | 38275 | 12777 | 45 | 16733 |
| University of Virginia, Charlottesville | 33 | 85 | 16 | 5138 | 29460 | 16488 | 32 | 19384 |
| University of California, Berkeley, Berkeley | 22 | 69 | 17 | 13164 | 36042 | 15863 | 41 | 16056 |
| University of Oklahoma, Norman | 85 | 33 | 18 | 11417 | 22370 | 6011 | 52 | 21517 |
| The University of North Carolina at Wilmington, Wilmington | 57 | 45 | 17 | 7367 | 19188 | 6792 | 25 | 19277 |
| University of Connecticut, Storrs | 54 | 66 | 18 | 14403 | 31299 | 8167 | 63 | 23237 |
| University of Michigan, Ann Arbor | 51 | 72 | 15 | 13170 | 38842 | 10783 | 46 | 27828 |
| University of Colorado at Boulder, Boulder | 83 | 41 | 18 | 14549 | 35727 | 7873 | 43 | 19758 |
Calculation: Use following steps to find the models in Minitab:
Step 1: Enter the data into Minitab worksheet.
Step 2: Go to Stat, select Regression, again select Regression.
Step 3: Select AvgDebt as Response and all Predictors one by one.
The models for each explanatory variable, model standard deviation
| Explanatory variable | Model | Model standard deviation s | P-value |
| Admit, | |||
| Yr4Grad | |||
| StudPerFac | |||
| InAfterAid | |||
| OutAfterAid | |||
| AvgAid | |||
| PercBorrow |
Interpretation: The regression line for the variable AvgAid is having a negative slope which verifies the conclusion drawn from the scattered plot in part (a).
(c)
The variable which appears to be best single predictor of average debt.
(c)
Answer to Problem 14E
Solution: InAfterAid is best single predictor of average debt.
Explanation of Solution
The model of each explanatory variable, model standard deviation
The independent variable with smallest P-value is the significant predictor of the model. As the P-value is minimum for the explanatory variable InAfterAid which is
Want to see more full solutions like this?
Chapter 10 Solutions
EBK INTRODUCTION TO THE PRACTICE OF STA


- Find four years weighted moving average? Forecast for 2019 with weights 1,4,2, ….. , Also find MAPE? (10 Year Cost 2013 18 2014 21 2015 18 2016 16 2017 20 2018 24 2019 ?arrow_forwardShow all your work. Indicate clearly the methods you use, because you will be scored on the correctness of your methods as well as on the accuracy and completeness of your results and explanations. At a financial institution, a fraud detection system identifies suspicious transactions and sends them to a specialist for review. The specialist reviews the transaction, the customer profile, and past history. If there is sufficient evidence of fraud, the transaction is blocked. Based on past history, the specialist blocks 40 percent of the suspicious transactions. Assume a suspicious transaction is independent of other suspicious transactions. (a) Suppose the specialist will review 136 suspicious transactions in one day. What is the expected number of blocked transactions by the specialist? Show your work. (b) Suppose the specialist wants to know the number of suspicious transactions that will need to be reviewed until reaching the first transaction that will be…arrow_forwardThe Seneca Children’s Fund (SCF) is a local charity that runs a summer camp for disadvantaged children. The fund’s board of directors has been working very hard over recent years to decrease the amount of overhead expenses, a major factor in how charities are rated by independent agencies. The following data show the percentage of the money SCF has raised that was spent on administrative and fund-raising expenses over the past seven years: Year Period (t) Expense (%) 2003 1 13.9 2004 2 12.2 2005 3 10.5 2006 4 10.4 2007 5 11.5 2008 6 10.0 2009 7 8.5 a. Construct a time series plot. What type of pattern exists in the data?b. Use simple linear regression analysis to find the parameters for the line that minimizes MSE for this time series.c. Forecast the percentage of administrative expenses for year 8.d. If SCF can maintain its current trend in reducing administrative expenses, how long will it take for SCF to achieve a level of 5% or less?arrow_forward
- i got half the problem right but i’m. it sure how to find the percent of debtors reported having no dependents?arrow_forwardAztec Industries has developed a forecasting model that was used to forecast during a 10-month period. The forecasts and actual demand were as follows: Measure the accuracy of the forecast by using MAD, MAPD, and cumulative error. Does the forecast method appear to be accurate?arrow_forwardAnnualized percentage return on investment (as compared to the Standard & Poor's 500 Index) for 10 randomly selected stock screeners are reproduced in the table. Complete parts a through c.arrow_forward
- Discuss the relationship between advertising expenditure and sales revenue.arrow_forwardMazars is an integral player in auditing, accounting, tax and advisory services in South Africa. A seasonal analysis was done on their sales for the period between 2009 and 2014 and the Median Seasonal Index's and the Adjusted Seasonal index's was calculated for each quarter as reflected below. Median seasonal Index Adjusted seasonal index Quarter 1 79.5660 79.0886 Quarter 2 85.3333 84.8213 Quarter 3 135.9855 135.1696 Quarter 4 101.5385 100.9293 Total 400.00 Each adjusted seasonal index measures the magnitude of seasonal influence on the actual values of the time series for a given period within the year. Interpret the seasonal analysis results for Quarter 1arrow_forwardABC is an online-to-offline platform that sells e-commerce products to offline customers through a network of agents. ABC gives a commission to agents for each sale made. ABC has 4 main product categories: electronics, fashion, supermarket, and others. Please refer to the exhibits for data sets pertaining to the questions below. Today is May 16th. What is the average growth in average sales per agent per month from March to May target? Answer: % Which one is the category with the highest and lowest average month-on-month sales growth from March to May target? Answer: Highest: Lowest: Today is May We have got the interim result of the sales figures in the first half of May. Typically, the first half of the month constitutes of 40% of sales. Using this assumption, will we reach our May target? What % over the target will we over/under-deliver? Answer: under/over-deliver by % of target Using that assumption, which category (or categories) will not reach the targeted sales…arrow_forward
- Morning House is a mail-order firm which carries a wide range of rather expensive art objects for homes and offices. It operate problems would be greatly reduced. Since it takes approximately six weeks to receive 90% of the response to a given campaign, an accurate prediction of total sales made as late as the end of the first week of receiving orders would be useful. The first week’s sales and total sales of the last 12 campaigns of the firm are shown below. Can the first week’s sales be used to predict total sales? First week’s Total Campaign Sales Sales 1 32 167 2 20 91 3 114 560 4 66 335 5 18 70 6 125 650 7 83 401 8 65 320 9 94 470 10 5 15 11 39 210 12 50 265 --------------------------------------------arrow_forwardThe selling prices of mutual funds change daily. In order to study these changes, a sample of mutual funds was examined and the daily changes in price are listed below. (Round answers to 3 decimal places) 0.32, -0.17, 0.26, -0.03, -0.01, 0.18, 0.33, 0.28, 0.02, -0.29, -0.08, 0.12, 0.07, 0.03, 0.28 a) Using a calculator find Q1, Q3, median and IQR b) Determine the lower and upper fences. (Show work) c) Identify the outliers (if any) in this setarrow_forwardThe stock market jumped 1% today. Lending Tree, a peer-to-peer lender, has a average daily range of 5.5%. Are these large movements and how do we tell?arrow_forward
 Glencoe Algebra 1, Student Edition, 9780079039897...AlgebraISBN:9780079039897Author:CarterPublisher:McGraw Hill