
Videos
LO1, LO2 10. Returns and Standard Deviations. Consider the following information:
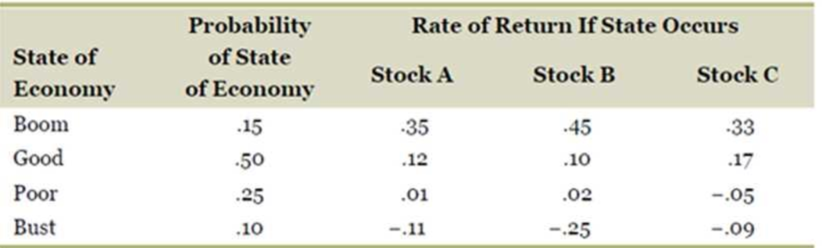
a. Your portfolio is invested 25 percent each in A and C and 50 percent in B. What is the expected return of the portfolio?
b. What is the variance of this portfolio? The standard deviation?
a)
To determine: The expected return on the portfolio.
Introduction:
Expected return refers to the return that the investors expect on a risky investment in the future.
Portfolio expected return refers to the return that the investors expect on a portfolio of investments.
Answer to Problem 10QP
The expected return on the portfolio is 0.1030 or 10.30%.
Explanation of Solution
Given information:
The probability of having a boom, good, poor, and bust economy are 0.15, 0.50, 0.25, and 0.10 respectively. Stock A’s return is 35 percent when the economy is booming, 12 percent when the economy is good, 1 percent when the economy is poor, and −11 percent when the economy is in a bust cycle.
Stock B’s return is 45 percent when the economy is booming, 10 percent when the economy is good, 2 percent when the economy is poor, and −25 percent when the economy is in a bust cycle.
Stock C’s return is 33 percent when the economy is booming, 17 percent when the economy is good, −5 percent when the economy is poor, and −9 percent when the economy is in a bust cycle. The weight of Stock A and Stock C is 25 percent each, and the weight of Stock B is 50 percent in the portfolio.
The formula to calculate the return on portfolio during a particular state of economy:
Where,
Rp refers to the return on portfolio
“x1 to xn” refers to the weight of each asset from 1 to “n” in the portfolio
R1 to Rn” refers to the rate of return on each asset from 1 to “n” in the portfolio
The formula to calculate the portfolio expected return:
Where,
E(RP) refers to the expected return on a portfolio
“x1 to xn” refers to the probability of each asset from 1 to “n” in the portfolio
“E(R1) to E(Rn)” refers to the expected return on each asset from 1 to “n” in the portfolio
Compute the return on portfolio during a boom:
Hence, the return on portfolio during a boom is 0.3950 or 39.50%.
Compute the return on portfolio during a good economy:
Hence, the return on portfolio during a good economy is 12.25%.
Compute the return on portfolio during a poor economy:
Hence, the return on portfolio during a poor economy is 0.000 or 0.00%.
Compute the return on portfolio during a bust cycle:
Hence, the return on portfolio during a bust cycle is −0.1750 or −17.50%.
Compute the expected return on portfolio:
Hence, the expected return on the portfolio is 0.1030 or 10.30%.
b)
To determine: The variance and standard deviation of the portfolio.
Introduction:
Portfolio variance refers to the average difference of squared deviations of the actual data from the mean or expected returns.
Standard deviation refers to the variation in the actual returns from the expected returns of the assets. The square root of variance gives the standard deviation.
Answer to Problem 10QP
The variance of the portfolio is 0.02336. The standard deviation of the portfolio is 15.28 percent.
Explanation of Solution
Given information:
The probability of having a boom, good, poor, and bust economy are 0.15, 0.50, 0.25, and 0.10 respectively. Stock A’s return is 35 percent when the economy is booming, 12 percent when the economy is good, 1 percent when the economy is poor, and −11 percent when the economy is in a bust cycle.
Stock B’s return is 45 percent when the economy is booming, 10 percent when the economy is good, 2 percent when the economy is poor, and −25 percent when the economy is in a bust cycle.
Stock C’s return is 33 percent when the economy is booming, 17 percent when the economy is good, −5 percent when the economy is poor, and −9 percent when the economy is in a bust cycle. The weight of Stock A and Stock C is 25 percent each, and the weight of Stock B is 50 percent in the portfolio.
The formula to calculate the variance of the portfolio:
The formula to calculate the standard deviation:
Compute the variance:
R1 refers to the returns of the portfolio during a boom. The probability of having a boom is P1. R2 is the returns of the portfolio in a good economy. The probability of having a good economy is P2. R3 is the returns of the portfolio in a poor economy. The probability of having a poor economy is P3. R4 is the returns of the portfolio in a bust cycle. The probability of having a bust cycle is P4.
Hence, the variance of the portfolio is 0.02336.
Compute the standard deviation:
Hence, the standard deviation of the portfolio is 0.1528 or 15.28%.
Want to see more full solutions like this?
Chapter 11 Solutions
Essentials of Corporate Finance (Mcgraw-hill/Irwin Series in Finance, Insurance, and Real Estate)


- Portfolio Suppose rA ~ N (0.05, 0.01), rB ~ N (0.1, 0.04) with pA,B = 0.2 where rA and rB are CCR’s. a) Suppose you construct a portfolio with 50% for A and 50% for B. Find the variance of the portfolio CCR. b) Find the portfolio expected gross return. c) Find the expected portfolio CCR.arrow_forwardc. Suppose the risk-free rate is 4.2 percent and the market portfolio has an expected return of 10.9 percent. The market portfolio has a variance of .0382. Portfolio Z has a correlation coefficient with the market of .28 and a variance of .3285. According to the capital asset pricing model, what is the expected return on Portfolio Z?arrow_forwardAnalyze investment M and investment J using the below. Scenario Probability M Return J Return Strong .30 18% 20% Normal .30 15% 12% Weak .40 9% 5% 1. What is the range for M? 2. What is the average exp. return for M ? 3. What is the standard deviation* M? 3.85 (given) 4. What is the CV for M? 5. What is the range for J? 6. What is the average exp. return for J? 7. What is the standard deviation J? 6.22 (given) 8. What is the CV for J? 9. Which is the better choice?arrow_forward
- Compute the (a) expected return, (b) standard deviation, and (c) coefficient of variation for investments with the following probability distributions: Probability r/A r/B 0.3 30.0% 5.0% 0.2 10.0 15.0 0.5 -2.0 25.0arrow_forwardAn investor has preferences represented by the utility function U = E(r) - 20². What is her certainty equivalent return for a portfolio with an expected return of 10% and a standard deviation of 15%? Oa. 1.0% O b. 2.5% O c. 0.5% O d. 5.5% O e. 10.0%arrow_forward1. Calculate the Expected Return and Risk measured in terms of standard deviation and Variance relating to the following information of a Investment avenue: Return in Percentage: -15-10-5+5+10+15 Probability:.10.15.20.20.25.10arrow_forward
- Q5. You are considering two assets with the following characteristics. Return Standard deviation Weights Asset 1 Asset 2 0.15 0.20 0.10 0.20 0.5 0.5 Compute the standard deviation of two portfolios if r1,2 = 0.40 and -0.60, respectively.arrow_forward2. The following table gives information on the return and variance of assets A and B, whose covariance is 0.0003: A B 0} 0,0009 0,0012 E (R₂) 0,05 0,06 a. Does the portfolio (1/3 of A and 2/3 of B) dominate the portfolio (2/3 of A and 1/3 of B)? b. Does the portfolio (1/2, 1/2) belong to the efficient frontier? c. If there were the possibility of lending and borrowing at 2%, would the portfolio (1/2, 1/2) belong to the new efficient frontier?arrow_forwardFollowing is the portfolio weights, w, percentage expected return in (%), R, vectors and variance-covariance matrix, VC, for a three-asset portfolio: 0.4 12 100 -45 10 w = [0.3], R = [10] and VC = [-45 64 10] 0.3 8 10 10 36 a. Calculate the expected return and standard deviation of the portfolio. b. Suppose an investor requires a target standard deviation of 4% for the portfolio; using the solver function in Excel, find the portfolio weights w to maximise the expected return subject to the constraints Op = 4 and wi + w2 + w3 = 1|arrow_forward
- Expected return and standard deviation. Use the following information to answer the questions: a. What is the expected return of each asset? b. What is the variance and the standard deviation of each asset? c. What is the expected return of a portfolio with 12% in asset J, 52% in asset K, and 36% in asset L? d. What is the portfolio's variance and standard deviation using the same asset weights from part (c)? Hint: Make sure to round all intermediate answers you will type. a. What is the expected return of asset J? (Round to four decimal places.) Data table (Click on the following icon in order to copy its contents into a spreadsheet.) Return on Asset J in State of Economy Boom Growth Stagnant Recession Probability of State 0.24 0.36 0.21 0.19 State 0.050 0.050 0.050 0.050 Return on Asset K in State 0.230 0.120 0.020 -0.060 Return on Asset L in State 0.250 0.190 0.065 - 0.190arrow_forwardConsider the following information for four portfolios, the market, and the risk-free rate (RFR): Portfolio Return Beta SD A1 0.15 1.25 0.182 A2 0.1 0.9 0.223 A3 0.12 1.1 0.138 A4 0.08 0.8 0.125 Market 0.11 1 0.2 RFR 0.03 0 0 Refer to Exhibit 18.6. Calculate the Jensen alpha Measure for each portfolio. a. A1 = 0.014, A2 = -0.002, A3 = 0.002, A4 = -0.02 b. A1 = 0.002, A2 = -0.02, A3 = 0.002, A4 = -0.014 c. A1 = 0.02, A2 = -0.002, A3 = 0.002, A4 = -0.014 d. A1 = 0.03, A2 = -0.002, A3 = 0.02, A4 = -0.14 e. A1 = 0.02, A2 = -0.002, A3 = 0.02, A4 = -0.14arrow_forward5. Consider the portfolios constructed from the two risky securities with expected returns, standard deviations of returns, and correlation between returns given in the following table. |1=0.10 M2 = 0.15 01 = = 0.28 02 = 0.24 P12 = -0.10 Find the equation of the minimum variance line w = μa + b.arrow_forward
 Essentials Of InvestmentsFinanceISBN:9781260013924Author:Bodie, Zvi, Kane, Alex, MARCUS, Alan J.Publisher:Mcgraw-hill Education,

 Foundations Of FinanceFinanceISBN:9780134897264Author:KEOWN, Arthur J., Martin, John D., PETTY, J. WilliamPublisher:Pearson,
 Fundamentals of Financial Management (MindTap Cou...FinanceISBN:9781337395250Author:Eugene F. Brigham, Joel F. HoustonPublisher:Cengage Learning
 Corporate Finance (The Mcgraw-hill/Irwin Series i...FinanceISBN:9780077861759Author:Stephen A. Ross Franco Modigliani Professor of Financial Economics Professor, Randolph W Westerfield Robert R. Dockson Deans Chair in Bus. Admin., Jeffrey Jaffe, Bradford D Jordan ProfessorPublisher:McGraw-Hill Education