
Concept explainers
Videos
(a)
Identify the test to be used.
(a)
Answer to Problem 3CRP
The test to be used is rank-sum test.
Explanation of Solution
The rank-sum test is the nonparametric test which is used when the data is independent. It is used for comparing the sample distributions that are taken from two populations which are independent. The rank-sum test is used for testing the difference between sample means and when the assumption of
In the scenario, the samples of ‘with catalyst’ and ‘without catalyst’ are independent of each other. This shows that, rank-sum test is appropriate to apply.
Hence, the test to be used is rank-sum test.
(b)
Find the level of significance.
State the null and alternative hypothesis.
(b)
Answer to Problem 3CRP
The level of significance is 0.05.
Explanation of Solution
Calculation:
From the given information the value of
Hence, the level of significance is 0.05.
The null and alternative hypothesis is,
Null hypothesis:
Alternative hypothesis:
(c)
Find the value of the sample test statistic.
(c)
Answer to Problem 3CRP
The value of the sample test statistic is 0.12.
Explanation of Solution
Calculation:
Test statistic:
The z value for the sample test statistic R is,
In the formula R is the sum of ranks from the sample of size
Procedure for assigned rank to data values:
- First combine both the samples.
- Arrange the data values in ascending order.
- Rank each of the data value in sequential order.
The rank for each of tied data is computed as,
- First assign the sequential position ranks for all the values that are same.
- Take the mean of all the position ranks that are assigned for same data values.
- Assign the mean rank as the rank position for all the tied data.
- The assigned mean rank is used in calculating the test statistic.
The ranks are,
| Index | Rank | Group |
| 1.1 | 1 | with catalyst |
| 1.5 | 2 | without catalyst |
| 1.6 | 3 | with catalyst |
| 1.8 | 4 | with catalyst |
| 1.9 | 5 | without catalyst |
| 2.2 | 6 | without catalyst |
| 2.4 | 7 | without catalyst |
| 2.5 | 8 | with catalyst |
| 2.8 | 9 | without catalyst |
| 2.9 | 10 | with catalyst |
| 3.1 | 11 | without catalyst |
| 3.2 | 12 | with catalyst |
| 3.3 | 13 | without catalyst |
| 3.5 | 14 | without catalyst |
| 3.6 | 15 | without catalyst |
| 3.7 | 16 | with catalyst |
| 3.8 | 17 | with catalyst |
| 3.9 | 18 | without catalyst |
| 4.0 | 19 | without catalyst |
| 4.1 | 20 | with catalyst |
| 4.2 | 21 | with catalyst |
| 4.4 | 22 | with catalyst |
| 4.6 | 23 | without catalyst |
The smaller sample is 11 which corresponds the ‘with catalyst’, and without catalyst sample size is 12. That is,
The value of R is,
The value of R is 134.
The mean of R is,
The standard deviation of R is,
Test statistic:
Substitute R as 134,
Hence, the z value is 0.12.
(d)
Find the P-value of the sample test statistic.
(d)
Answer to Problem 3CRP
The P-value is 0.9044.
Explanation of Solution
Calculation:
Step by step procedure to obtain P-value using MINITAB software is given below:
- Choose Graph > Probability Distribution Plot choose View Probability > OK.
- From Distribution, choose ‘Normal’ distribution.
- Click the Shaded Area tab.
- Choose X Value and Both Tail, for the region of the curve to shade.
- Enter the X value as 0.12.
- Click OK.
Output using MINITAB software is given below:
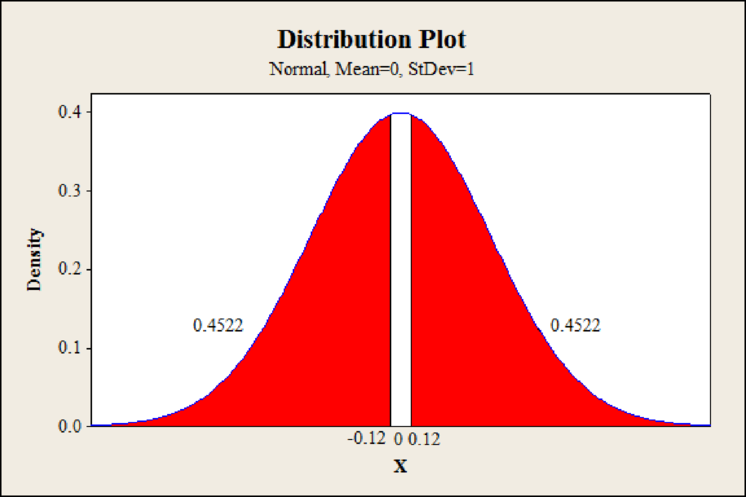
From Minitab output, the P-value is 0.4522 which is one sided value.
The two-tailed P-value is,
Hence, the P-value is 0.9044.
(e)
Mention the conclusion of the test.
Interpret the conclusion in the context of the application.
(e)
Answer to Problem 3CRP
The null hypothesis is failed to be rejected.
Explanation of Solution
Calculation:
From part (d), the P-value is 0.9044.
Rejection rule:
- If the P-value is less than or equal to
Conclusion:
The P-value is 0.9044 and the level of significance is 0.05.
The P-value is greater than the level of significance.
That is,
By the rejection rule, the null hypothesis is failed to be rejected.
Hence, the data is not statistically significant at level 0.05.
There is no sufficient evidence that the distributions of viscosity index for with catalyst and without catalyst are different at level of significance 0.05.
Want to see more full solutions like this?
Chapter 11 Solutions
Understandable Statistics: Concepts and Methods


- Inorganic phosphorous is a naturally occurring element in all plants and animals, with concentrations increasing progressively up the food chain (fruit < vegetables < cereals < nuts < corpse). Geochemical surveys take soil samples to determine phosphorous content (in ppm, parts per million). A high phosphorous content may or may not indicate an ancient burial site, food storage site, or even a garbage dump. Independent random samples from two regions gave the following phosphorous measurements (in ppm). Assume the distribution of phosphorous is mound-shaped and symmetric for these two regions Region I: x1; n1 = 15 855 1550 1230 875 1080 2330 1850 1860 2340 1080 910 1130 1450 1260 1010 Region II: x2; n2 = 14 540 810 790 1230 1770 960 1650 860 890 640 1180 1160 1050 1020 (a) Use a calculator with mean and standard deviation keys to verify that x1, s1, x2, and s2. (Round your answers to one decimal place.) x1 = ppm s1 = ppm x2 = ppm s2 = ppm (b)…arrow_forwardInorganic phosphorous is a naturally occurring element in all plants and animals, with concentrations increasing progressively up the food chain (fruit < vegetables < cereals < nuts < corpse). Geochemical surveys take soil samples to determine phosphorous content (in ppm, parts per million). A high phosphorous content may or may not indicate an ancient burial site, food storage site, or even a garbage dump. Independent random samples from two regions gave the following phosphorous measurements (in ppm). Assume the distribution of phosphorous is mound-shaped and symmetric for these two regions. Region I: x,; n, = 15 875 1,080 2,330 1,850 1,860 853 1,551 1,230 2,340 1,080 910 1,130 1,450 1,260 1,010 Region II: x,; n, = 14 540 808 790 1,230 1,770 960 1,650 860 890 640 1,180 1,160 1,050 | 1,020 In USE SALT (a) Use a calculator with mean and standard deviation keys to verify that x,, S,, x2, and s,. (Round your answers to four decimal places.) X1 ppm S. = ppm X2 ppm 52 ppm (b) Let u, be the…arrow_forwardInorganic phosphorous is a naturally occurring element in all plants and animals, with concentrations increasing progressively up the food chain (fruit < vegetables < cereals < nuts < corpse). Geochemical surveys take soil samples to determine phosphorous content (in ppm, parts per million). A high phosphorous content may or may not indicate an ancient burial site, food storage site, or even a garbage dump. Independent random samples from two regions gave the following phosphorous measurements (in ppm). Assume the distribution of phosphorous is mound-shaped and symmetric for these two regions Region I: x1; n1 = 15 855 1550 1230 875 1080 2330 1850 1860 2340 1080 910 1130 1450 1260 1010 Region II: x2; n2 = 14 540 810 790 1230 1770 960 1650 860 890 640 1180 1160 1050 1020 (a) Use a calculator with mean and standard deviation keys to verify that x1, s1, x2, and s2. (Round your answers to one decimal place.) x1 = ppm s1 = ppm x2 = ppm s2 = ppm…arrow_forward
- Inorganic phosphorous is a naturally occurring element in all plants and animals, with concentrations increasing progressively up the food chain (fruit < vegetables < cereals < nuts < corpse). Geochemical surveys take soil samples to determine phosphorous content (in ppm, parts per million). A high phosphorous content may or may not indicate an ancient burial site, food storage site, or even a garbage dump. Independent random samples from two regions gave the following phosphorous measurements (in ppm). Assume the distribution of phosphorous is mound-shaped and symmetric for these two regions. Region 1: x1;n1=15 857 1,551 1,230 875 1,080 2,330 1,850 1,860 2,340 1,080 910 1,130 1,450 1,260 1,010 region 11: x2;n2-14 538 812 790 1,230 1,770 960 1,650 860 890 640 1,180 1,160 1,050 1,020 (a)Use a calculator with mean and standard deviation keys to verify that x1, s1, x2, and s2. (Round your answers to four decimal places.) x1= ppm s1= ppm x2= ppm s2= ppm…arrow_forwardInorganic phosphorous is a naturally occurring element in all plants and animals, with concentrations increasing progressively up the food chain (fruit < vegetables < cereals < nuts < corpse). Geochemical surveys take soil samples to determine phosphorous content (in ppm, parts per million). A high phosphorous content may or may not indicate an ancient burial site, food storage site, or even a garbage dump. Independent random samples from two regions gave the following phosphorous measurements (in ppm). Assume the distribution of phosphorous is mound-shaped and symmetric for these two regions. Region I: x,; n, = 15 857 1,553 1,230 875 1,080 2,330 1,850 1,860 2,340 1,080 910 1,130 1,450 1,260 1,010 Region II: x2; n2 = 14 538 810 790 1,230 1,770 960 1,650 860 890 640 1,180 1,160 1,050 1,020 n USE SALT (a) Use a calculator with mean and standard deviation keys to verify that x,, s,, X2, and s,. (Round your answers to four decimal places.) X, = ppm S, = ppm X2 ppm S2 ppm %3D (b) Let u, be…arrow_forwardInorganic phosphorous is a naturally occurring element in all plants and animals, with concentrations increasing progressively up the food chain (fruit < vegetables < cereals < nuts < corpse). Geochemical surveys take soil samples to determine phosphorous content (in ppm, parts per million). A high phosphorous content may or may not indicate an ancient burial site, food storage site, or even a garbage dump. Independent random samples from two regions gave the following phosphorous measurements (in ppm). Assume the distribution of phosphorous is mound-shaped and symmetric for these two regions. REGION I:X1;N1=15 857 1,551 1,230 875 1,080 2,330 1,850 1,860 2,340 1,080 910 1,130 1,450 1,260 1,010 REGION II:X2;N2=14 538 812 790 1,230 1,770 960 1,650 860 890 640 1,180 1,160 1,050 1,020 (a) Use a calculator with mean and standard deviation keys to verify that x1, s1, x2, and s2. (Round your answers to four decimal places.) x1= ppm s1= ppm x2= ppm s2= ppm…arrow_forward
- Inorganic phosphorous is a naturally occurring element in all plants and animals, with concentrations increasing progressively up the food chain (fruit < vegetables < cereals < nuts < corpse). Geochemical surveys take soil samples to determine phosphorous content (in ppm, parts per million). A high phosphorous content may or may not indicate an ancient burial site, food storage site, or even a garbage dump. Independent random samples from two regions gave the following phosphorous measurements (in ppm). Assume the distribution of phosphorous is mound-shaped and symmetric for these two regions. Region I: x,; n, = 15 853 1,551 1,230 1,080 2,330 1,850 1,860 875 2,340 1,080 910 1,130 1,450 1,260 1,010 Region II: x,; n, = 14 540 1,230| 1,770 808 790 960 1,650 860 890 640 1,180 1,160 | 1,050 1,020 In USE SALT (a) Use a calculator with mean and standard deviation keys to verify that x,, S,, x2, and s,. (Round your answers to four decimal places.) x, = X1 ppm S1 ppm X2 ppm S2 , = ppm (b) Let…arrow_forwardInorganic phosphorous is a naturally occurring element in all plants and animals, with concentrations increasing progressively up the food chain (fruit < vegetables < cereals < nuts < corpse). Geochemical surveys take soil samples to determine phosphorous content (in ppm, parts per million). A high phosphorous content may or may not indicate an ancient burial site, food storage site, or even a garbage dump. Independent random samples from two regions gave the following phosphorous measurements (in ppm). Assume the distribution of phosphorous is mound-shaped and symmetric for these two regions Region I: x1; n1 = 15 855 1550 1230 875 1080 2330 1850 1860 2340 1080 910 1130 1450 1260 1010 Region II: x2; n2 = 14 540 810 790 1230 1770 960 1650 860 890 640 1180 1160 1050 1020 (a) Use a calculator with mean and standard deviation keys to verify that x1, S1, X2, and s2. (Round your answers to one decimal place.) X1 ppm S1 = ppm X2 = ppm S2 = ppm (b) Let µ1 be the population mean for x1 and let…arrow_forwardInorganic phosphorous is a naturally occurring element in all plants and animals, with concentrations increasing progressively up the food chain (fruit < vegetables < cereals < nuts < corpse). Geochemical surveys take soil samples to determine phosphorous content (in ppm, parts per million). A high phosphorous content may or may not indicate an ancient burial site, food storage site, or even a garbage dump. Independent random samples from two regions gave the following phosphorous measurements (in ppm). Assume the distribution of phosphorous is mound-shaped and symmetric for these two regions. Region I: x1; n1 = 15 857 1,551 1,230 875 1,080 2,330 1,850 1,860 2,340 1,080 910 1,130 1,450 1,260 1,010 Region II: x2; n2 = 14 538 808 790 1,230 1,770 960 1,650 860 890 640 1,180 1,160 1,050 1,020 (a) Use a calculator with mean and standard deviation keys to verify that x1, s1, x2, and s2. (Round your answers to four decimal places.) x1= 1387.5333 ppm s1=…arrow_forward
- Five students provided data regarding the number of hours they spent on studying (TimeStudy) and their GPA. The data are as follows. Answer the following questions. TimeStudy GPA Student 1 2.00 3.50 Student 2 4.00 3.70 Student 3 5.00 3.30 Student 4 3.00 2.60 Student 5 4.00 3.40 Where SS(residual)=∑i(yi−yˆi)^2 is 0.6829 Calculate (by hand) the SStotal and SSmodel. What does mean by “goodness of fit”? What is the F-ratio for testing the “goodness of fit”? Is it statistically significant? Calculate this question by hand. What does tobs = 3.47 mean? What does tcrit = 3.47 mean? If the ƞ2 in an experiment is 0.6, give any possible value of ω2.arrow_forwardRoy ‘s Texaco wants to keep the price of its unleaded gasoline competitive with that of other stations in the area. Roy’s is currently charging $1.29 per gallon. To check that the average price for this gasoline for all stations within a 15 mile radius is higher than his price, Roy randomly samples the price of unleaded gasoline at ten stations located in this area. He obtains the following data for the price per gallon (in dollars): 1.7, 1.5, 2.6, 2.2, 2.4, 2.3, 2.6, 3.0, 1.4, 2.3 Set up the appropriate hypotheses and test them using a significance level of α= .05arrow_forwardTotal plasma volume is important in determining the required plasma component in blood replacement therapy for a person undergoing surgery. Plasma volume is influenced by the overall health and physical activity of an individual. Suppose that a random sample of 44 male firefighters are tested and that they have a plasma volume sample mean of x = 37.5 ml/kg (milliliters plasma per kilogram body weight), Assume that o = 8.00 ml/kg for the distribution of blood plasma.arrow_forward
 Glencoe Algebra 1, Student Edition, 9780079039897...AlgebraISBN:9780079039897Author:CarterPublisher:McGraw Hill