
Probability and Statistics for Engineering and the Sciences
9th Edition
ISBN: 9781305251809
Author: Jay L. Devore
Publisher: Cengage Learning
expand_more
expand_more
format_list_bulleted
Videos
Textbook Question
Chapter 11.4, Problem 40E
In a study of processes used to remove impurities from cellulose goods (“Optimization of Rope-
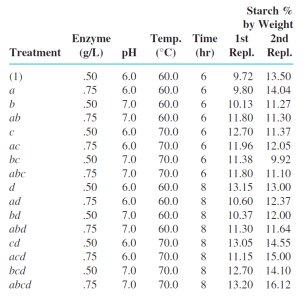
a. Use Yates’s algorithm to obtain sums of squares and the ANOVA table.
b. Do there appear to be any second-, third-, or fourth-order interaction effects present? Explain your reasoning. Which main effects appear to be significant?
Expert Solution & Answer
Want to see the full answer?
Check out a sample textbook solution
Students have asked these similar questions
Che
Required information
To assess the effect of piston ring type and oil type on piston ring wear, three types of piston rings and four types of oil
were studied. Three replications of an experiment, in which the number of milligrams of material lost from the ring in
four hours of running was measured, were carried out for each of the 12 combinations of oil type and piston ring type.
With oil type as the row effect and piston ring type as the column effect, the following sums of squares were observed:
SSA = 1.293, SSB = 0.9340, SSAB 0.2485, SSE 1.7034.
Construct an ANOVA table. (Enter your Sum of Squares, Mean Sum of Squares, and F calculations rounded to three decimal
Source
Oil
Ring
Interaction
Error
Total
DF
SS
MS
F
P
(Click to select)
(Click to select)
(Click to select)
A developmental psychologist experiment to determine if exposure to an enriched environment shortly after birth will cause increased brain development. Twenty, two-month-old rats are randomly selected from a pool of one thousand two-month-old rat pups. Ten of the twenty pups are exposed to an enriched environment for three weeks and the other ten to the usual environment for the same period of time. At a suitable time after the exposure, the psychologist measures the number of neurons per cm3 in each rat's brain. A comparison is then made of the mean number of neurons per cm3 for each group.a. What is the population?b. What is the independent variable?c. What is the sample?d. What is the statistics?e. What is the dependent variable?
Researchers were interested in whether certain health behaviors can reduce the number of sick days employees take. Employees were randomly assigned to three groups, with a separate sample of n = 10 in each group. Group 1 was asked to eat 5 servings of fruits and vegetables a week for a year. Group 2 was asked to eat 5 servings of fruits and vegetables a week, as well as exercise 5 times a week, for a year. Group 3 served as the control group; they were not asked to change their behaviors. At the end of the year, the researchers compared the number of sick days.
Healthy Diet
Healthy Diet & Exercise
Control
∑X = 156
∑X2 = 860
M1 = 5.00
M2 = 4.40
M3 = 6.20
N = 30
S1 = 1.05
S2 = 1.07
S3 = 1.15
k = 3
SS1 = 10.00
SS2 = 10.40
SS3 = 11.80
T1 = 50.00
T2 = 44.00
T3 = 62.00
Define hypotheses
Find the critical value and rejection region using alpha = .05.
Fill in the ANOVA summary table to calculate the test statistic F…
Chapter 11 Solutions
Probability and Statistics for Engineering and the Sciences
Ch. 11.1 - An experiment was carried out to investigate the...Ch. 11.1 - Four different coatings are being considered for...Ch. 11.1 - Prob. 3ECh. 11.1 - In an experiment to see whether the amount of...Ch. 11.1 - In an experiment to assess the effect of the angle...Ch. 11.1 - A particular county employs three assessors who...Ch. 11.1 - Prob. 7ECh. 11.1 - The paper Exercise Thermoregulation and...Ch. 11.1 - The article The Effects of a Pneumatic Stool and a...Ch. 11.1 - Prob. 10E
Ch. 11.1 - Prob. 11ECh. 11.1 - Prob. 12ECh. 11.1 - Prob. 13ECh. 11.1 - Prob. 14ECh. 11.1 - The power curves of Figures 10.5 and 10.6 can be...Ch. 11.2 - In an experiment to assess the effects of curing...Ch. 11.2 - Prob. 17ECh. 11.2 - The accompanying data resulted from an experiment...Ch. 11.2 - A two-way ANOVA was carried out to assess the...Ch. 11.2 - The article Fatigue Limits of Enamel Bonds with...Ch. 11.2 - In an experiment to investigate the effect of...Ch. 11.2 - Prob. 22ECh. 11.2 - Prob. 23ECh. 11.2 - Prob. 24ECh. 11.2 - Prob. 25ECh. 11.2 - Prob. 26ECh. 11.3 - The output of a continuous extruding machine that...Ch. 11.3 - Prob. 28ECh. 11.3 - Prob. 29ECh. 11.3 - Prob. 30ECh. 11.3 - Nickel titanium (NiTi) shape memory alloy (SMA)...Ch. 11.3 - Prob. 32ECh. 11.3 - Prob. 33ECh. 11.3 - The article The Responsiveness of Food Sales to...Ch. 11.3 - Prob. 35ECh. 11.3 - Prob. 36ECh. 11.3 - Prob. 37ECh. 11.4 - The accompanying data resulted from an experiment...Ch. 11.4 - The accompanying data resulted from a 23...Ch. 11.4 - In a study of processes used to remove impurities...Ch. 11.4 - Prob. 41ECh. 11.4 - Prob. 42ECh. 11.4 - Prob. 43ECh. 11.4 - a. In a 24 experiment, suppose two blocks are to...Ch. 11.4 - a. An experiment was carried out to investigate...Ch. 11.4 - Prob. 46ECh. 11.4 - a. In a seven-factor experiment (A,, G), suppose a...Ch. 11.4 - The article Applying Design of Experiments to...Ch. 11 - The results of a study on the effectiveness of...Ch. 11 - Prob. 51SECh. 11 - Prob. 52SECh. 11 - In an automated chemical coating process, the...Ch. 11 - Coal-fired power plants used in the electrical...Ch. 11 - Impurities in the form of iron oxides lower the...Ch. 11 - Factorial designs have been used in forestry to...Ch. 11 - Prob. 57SECh. 11 - Prob. 58SECh. 11 - The bond strength when mounting an integrated...Ch. 11 - Prob. 60SECh. 11 - Prob. 61SE
Knowledge Booster


Learn more about
Need a deep-dive on the concept behind this application? Look no further. Learn more about this topic, statistics and related others by exploring similar questions and additional content below.Similar questions
- When factors A and B are fixed but factor C is random and the restricted model is used, and E(MSE) = ² JKL 1-1 Σa, ² IKL J-1 1B, ² E(MSA) = ² + JLG AC² + E(MSB) = ² + ILO Bc² + E(MSC) = 2 + IJLO 2 E(MSAB) = 2 + LO ABC² + E(MSAC) = ² + JLOAC² E(MSBC) = 02 + ILO BC E(MSABC) = 0² + ABC² MSAB/MSABC 4 (a) Based on these expected mean squares, what F ratios would you use to test the following? Ho: ABC² = 0 OMSA/MSAC OMSAC/MSE OMSABC/MSA OMSC/MSABC OMSABC/MSE OMSA/MSE OMSC/MSE ΣΣΑΒ H₂:0² = 0 O MSC/MSE KL (I-1)(J-1) TJarrow_forwardA machine shop has three machines used in precision grinding of cam rollers. Threemachinists are employed to grind rollers on the machines. In an experiment to determinewhether there are differences in output among the machines or their operators, each operatorworked on each machine on four different days. The outcome measured was the dailyproduction of parts that met specifications. With the operator as the row effect and themachine as the column effect, the following sums of squares were observed: SSA = 3147.0,SSB = 136.5, SSAB = 411.7, SSE = 1522.0.a) How many degrees of freedom are there for the operator effect?b) How many degrees of freedom are there for the machine effect?c) How many degrees of freedom are there for interactions?d) How many degrees of freedom are there for error?e) Construct an ANOVA table. You may give ranges for the P-values.f) Is the additive model plausible? Provide the value of the test statistic and the P-value.g) Is it plausible that the main effects of…arrow_forwardb) The following table shows the results of a sample survey carried out by a fast-food restaurant to determine whether persons had noticed an improvement in its service in the last month Voting Results Sex Improvement Seen No Opinion No improvement Male 25 21 34 Female 16 38 16 i. How many people were in the survey? ii. A patron was selected at random from the sample. a) Determine the probability that the patron thought that there was an improvement in service. b) Determine the probability that the patron was a female or thought that there was no improvement in the service. c) Given that the patron thought there was an improvement, what is the probability that the patron was a male?arrow_forward
- 1. A researcher observed a rat respond for a food reward by pressing one of the three levers in a cage. Pressing the lever to the right (R) produced no food reward. pressing the lever to the left (L) produced a single food pellet, and pressing the lever at the center (C) produced two food pellets. Because the center level produced the largest reward, the researcher hypothesized that the rat would press this lever most often. Each trial ended when the rat produced a level. The researcher recorded lever pressing for 30 trials. L, L, R, L, R, C, R, L, C, L, L, C, C, C, R, C, R, C, L, C, C, L, C, C, C, L, C, C, C, C, C - Create the appropiate graph for this data - Do these data support the hypothesis? Explain. 2. Which scales of measurement are assumed to be discrete? What does this mean? Which scales of measurement are assumed to be continuous? What does this mean? 3. What type of graph should you create to visualize the following frequency data? Explain. -…arrow_forward40. In a study of processes used to remove impurities from cellulose goods ("Optimization of Rope- Range Bleaching of Cellulosic Fabrics," Textile Research J., 1976: 493-496), the following data resulted from a 2 experiment involving the desiz- ing process. The four factors were enzyme concentration (A), pH (B), temperature (C), and time (D). Starch % by Weight En- Treat- zyme ment (gL) pH (C) Temp. Time 1st 2nd (hr) Repl. Repl. (1) a. b. 60.0 60.0 60.0 6. 9.80 14.04 6. 50 .75 50 .75 50 .75 50 75 50 6.0 6.0 9.72 13.50 10.13 11.27 7.0 60.0 70.0 ab 7.0 6. 11.80 11.30 6.0 6. 12.70 11.37 ac 6.0 70.0 6. 11.96 12.05 6. 11.38 9.92 70.0 70.0 60.0 60.0 60.0 60.0 70.0 70.0 70.0 70.0 be 7.0 7.0 abc. 6. 11.80 11.10 13.15 13.00 10.60 12.37 10.37 12.00 11.30 11.64 13.05 14.55 11.15 15.00 6.0 .75 ad bd abd 6.0 50 .75 7.0 7.0 6.0 6.0 7.0 7.0 cd acd 50 .75 50 8. 12.70 14.10 13.20 16.12 bcd abcd .75 a Use Yates's algorithm to obtain sums of squares and the ANOVA table. b. Do there appear to be any…arrow_forwardNeuroscience researchers examined the impact of environment on rat development. Rats were randomly assigned to be raised in one of the four following test conditions: Impoverished (wire mesh cage - housed alone), standard (cage with other rats), enriched (cage with other rats and toys), super enriched (cage with rats and toys changes on a periodic basis). After two months, the rats were tested on a variety of learning measures (including the number of trials to learn a maze to a three perfect trial criteria), and several neurological measure (overall cortical weight, degree of dendritic branching, etc.). The data for the maze task is below. Compute the appropriate test for the data provided below. Include solution. Thank youarrow_forward
- One way to measure the diversity of a population of organisms is to calculate its Gini-Simpson diversity index, H. In its simplest incarnation, consider a population of yeast cells; each yeast cell is one of two types (call them "red" and "green"). The diversity index of the population is the probability that if two cells are picked at random, they are different colors (i.e., one is red and the other is green). If p is the proportion of cells of red-type, the diversity index H can be calculated from p using the formula H(p) = 2p(1- p), pe[0,1]. Conversely, one could ask what is the probability that the two individuals are genetically identical. Call this probability I(p). It is given by I(p) = 2p - 2p + 1. Complete parts (a) through (c) below. (a) The function I(p) is known as the Simpson index. Explain why the domain of I is pE[0,1]. Choose the correct answer below. O A. Substituting a negative value or a value greater than 1 for p in I(p) results in an undefined expression. O B. The…arrow_forwardAn agricultural scientist tests six types of fertilizer, labeled A, B, C, D, E, and F, to determine whether any of them produces an increase in the yield of lima beans over that obtained with the current fertilizer. For fertilizer C, the increase in yield is statistically significant at the 0.05 level. For the other five, the increase is not statistically significant. The scientist concludes that the yield obtained with fertilizer C is greater than that of the current fertilizer. Explain why this conclusion is not justified.arrow_forwardPeople are classified as hypertensive if their systolic bloodpressure (SBP) is higher than a specified level for their agegroup, according to the algorithm in Table 5.1.Assume SBP is normally distributed with mean andstandard deviation given in Table 5.1 for age groups 1−14and 15−44, respectively. Define a family as a group of twopeople in age group 1−14 and two people in age group15−44. A family is classified as hypertensive if at least oneadult and at least one child are hypertensive. 5.17) What proportion of 1- to 14-year-olds are hypertensive? 5.18) What proportion of 15- to 44-year-olds are hyper-tensive?arrow_forward
- The Math coordinator at Houston Community College collected the following data from first and second year students enrolled in the department's Spring classes. Any given student could only have been enrolled in one course. MATH 1324 (X) MATH 1314 (Y) MATH 1332 (Z) Total First year (A) Second year (B) 37 (d) Compute P(X U A). 42 (e) Compute P(YN BC). 21 100 19 40 50 109 Total 56 82 | 71 All answers to the following questions should be exact. (a) If a student is selected at random, what is the probability the student is a first year or a second year student? 1 209 (b) If a student is selected at random, what is the probability the student is not taking MATH 1324 and is not taking MATH 1332? 82/209 (c) If a student is selected at random, what is the probability the student is not taking MATH 1324 or is not taking MATH 1332?arrow_forwardThe following table shows the number of sales- men working ima certain concern. Year 1980 1981 1982 1983 1984 No. of Salesmen 28 38 46 40 56 : Use the method of least squares to fit a straight line trend and estimate the number of salesmen in 1985.arrow_forwardA lumber company has just taken delivery on a shipment of 10,000 2 x 4 boards. Suppose that 40% of these boards (4000) are actually too green to be used in first-quality construction. Two boards are selected at random, one after the other. Let A = {the first board is green} and B = {the second board is green}. (a) Compute P(A), P(B), and P(A n B) (a tree diagram might help). (Round your answer for P(A n B) to five decimal places.) P(A) = Р(B) %D P(A n B) = Are A and B independent? O Yes, the two events are independent. No, the two events are not independent. (b) With A and B independent and P(A) = P(B) = 0.4, what is P(A n B)? How much difference is there between this answer and P(A n B) in part (a)? There is no difference. There is very little difference. There is a very large difference. For purposes of calculating P(A n B), can we assume that A and B of part (a) are independent to obtain essentially the correct probability? Yes No (c) Suppose the lot consists of ten boards, of which…arrow_forward
arrow_back_ios
SEE MORE QUESTIONS
arrow_forward_ios
Recommended textbooks for you
 Calculus For The Life SciencesCalculusISBN:9780321964038Author:GREENWELL, Raymond N., RITCHEY, Nathan P., Lial, Margaret L.Publisher:Pearson Addison Wesley,
Calculus For The Life Sciences
Calculus
ISBN:9780321964038
Author:GREENWELL, Raymond N., RITCHEY, Nathan P., Lial, Margaret L.
Publisher:Pearson Addison Wesley,
Hypothesis Testing using Confidence Interval Approach; Author: BUM2413 Applied Statistics UMP;https://www.youtube.com/watch?v=Hq1l3e9pLyY;License: Standard YouTube License, CC-BY
Hypothesis Testing - Difference of Two Means - Student's -Distribution & Normal Distribution; Author: The Organic Chemistry Tutor;https://www.youtube.com/watch?v=UcZwyzwWU7o;License: Standard Youtube License