
The effect of changes in price of oil along with subsidy on the price of corn, wheat, and farmland.
Explanation of Solution
The effect of changes in price of oil along with subsidy on the price of corn is depicted in Figure 1 using the
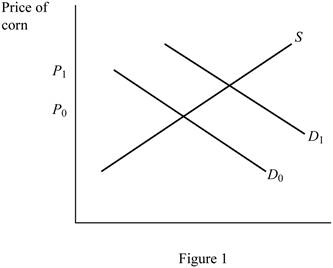
In Figure 1, the horizontal axis represents the quantity of corn, whereas the vertical axis denotes the price of corn.
The effect of changes in price of oil along with subsidy on the price of farmland is depicted in Figure 2 using the demand and supply model.
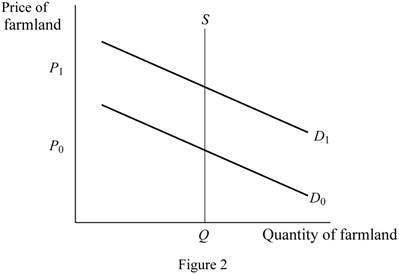
In Figure 2, the horizontal axis represents the quantity of farmland, whereas the vertical axis denotes the price of farmland.
The effect of changes in price of oil along with subsidy on the price of other agricultural products such as wheat is depicted in Figure 3 using the demand and supply model.
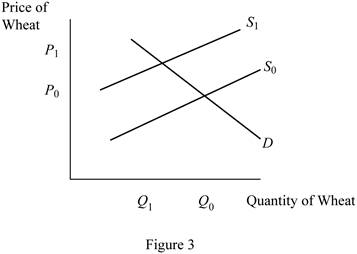
In Figure 3, the horizontal axis represents the quantity of wheat, whereas the vertical axis denotes the price of wheat.
When the oil prices increase simultaneously with the rolling out of subsidy in ethanol production, the demand for ethanol will increase. As the demand for ethanol increases, the demand for corn used for its production also increases. This shifts the demand curve of corn to the right from D0 to D1 as in Figure 1. This increases the price of the corn.
As a result of it, the market value of farmland will increase due to the increase in demand for land as depicted in Figure 2 causing the rightward shift of the demand for land from D0 to D1 as in figure 2.
From now, more of the farmland would be devoted to the production of corn; less of it would be available for the production of other agricultural products such as wheat. This implies that the supply of wheat would decrease causing a leftward shift of the supply curve from S0 to S1 as in Figure 3, thereby increasing the price of wheat.
When the oil prices decreases, the demand for ethanol will decrease. As the demand for ethanol decreases, the demand for corn used for its production also decreases. This shifts the demand curve of corn to the left from D1 to D0 as in Figure 1. This decreases the price of the corn.
As a result of it, the market value of farmland will decrease due to the decrease in demand for land for corn production as depicted in Figure 2 causing the leftward shift of the demand for land from D1 to D0 as in Figure 2. This decreases the price of the farmland.
From now, less of the farmland would be devoted to the production of corn; more of it would be available for the production of other agricultural products such as wheat. This implies that the supply of wheat would increase causing a rightward shift of the supply curve from S1 to S0 as in figure 3, thereby decreasing the price of wheat.
Demand: Demand is the quantity of goods and services that people are willing and able to buy at different prices in a given period of time.
Supply: Supply is the quantity of goods and services that people are willing to sell at different prices in a given period of time.
Want to see more full solutions like this?
Chapter 12 Solutions
Principles of Economics (12th Edition)

- The Agriculture Research Center of a country (a government organization) introduced a new and innovative irrigation technique that would ensure that water usage declined by almost 40 percent. Part of this would be achieved by reducing wastage of water caused by field inundations. This would not only be more sustainable in the long run, but would also benefit farmers. Samira Fernandes, one of the leading researchers at the Center, believes that this innovation would make farming more efficient since a majority of the farmers, if not all, implemented it. Bob Johnson, her colleague, however felt that farmers might be reluctant to use the new irrigation technique. Which of the following, if true, would support Samira's view? A. Switching costs involved in adopting this new technology are low. B. Farmers in neighboring countries have usually been reluctant to use new techniques. C. Traditional farming practices have served farmers well in the past. D. The opportunity cost of the investment…arrow_forwardEthanol and sugar are both made from sugarcane, and ethanol can be used as a fuel substitute for oil. Increasing oil prices cause the demand for ethanol to increase. This will cause the ______ sugar to ______ and its price to ______. demand for; increase; increase supply of; decrease; increase demand for; decrease; decrease supply of; increase; increasearrow_forwardQuestion #3. Assume the annual aluminum can market is characterized by a demand curve represented by the linear equation: P = -15Q + 1200. Assume also that aluminum cans are produced using both virgin and recycled material. The supply curve for cans made from recycled material is represented by the equation: P = 5Q + 50. The supply curve for cans made from virgin material is represented by a constant marginal cost of $250. What is the total equilibrium quantity of aluminum cans produced in this market? How many cans would be produced with recycled material? How many cans would be produced using virgin material? What is the recycling ratio in this market? What would be the new recycling ratio if the government decides to levy a flat tax of $10 on virgin material? Who would benefit from this type of tax? Explain your answer.arrow_forward
- Draw a neat and well labeled graph that includes ARC, AVC, ATC and MC curves to show the effect of a per-unit subsidy provided to a local bakery that bakes healthy baked goods. Make sure to draw both sets of graphs (pre and post subsidy) in one graphical space. (This is the entire question it is not missing parts). The graph is supposed to be a general representation of ARC, AVC, ATC, and MC and not an exact one based on numercial values)arrow_forwardIn his State of the Union address in 2003, President Bush supported the idea of changing from the use of internal combustion engines to fuel cells based on hydrogen as a way of reducing air pollution and the emission of greenhouse gases. Fuel cells are nonpolluting because they only emit water vapor. President Bush proposed having the government subsidize research and development of hydrogen fuel and fuel cell technology. The president did not propose raising taxes on gasoline as a way of encouraging the use of fuel cells and reducing greenhouse gases. Currently, hydrogen is more expensive than gasoline. Would an increase in the tax on gasoline encourage the development of hydrogen-based fuel cell technology for automobiles?arrow_forwardThe oversupply of bananas in Mexico, which is recorded in the months of September and October, causes prices to farmers to be reduced by up to 50 percent below the cost of production, said Adrián Prats, president of the banana product system at the national. "It is a critical situation, we are selling the fruit below the cost of production, which is when it really impacts the producer, since he has to continue maintaining his plantations healthy and vigorous and that costs. We have to invest in it, even though the price is not giving to pay, even, the costs", explained Prats. The above causes: a. By decreasing the price of bananas, marginal income decreases and therefore, production must be increased (T/F) _________ b. By lowering the price, the company will have to take care of its costs. To avoid leaving the market, the producer must ensure that, at least, the average variable costs (T/F) _______ are covered c. It is recommended that a banana producer who invests in keeping his…arrow_forward
- Consider the competitive market for production of a chemical as shown in the diagram below. This setup will apply to this question and the next two questions. P ($/gallon) Demand: P=220-Q/100 0 Supply: P = Q/400 Q (gallons) Production of this chemical produces noxious odors that impact the health of the communities surrounding the production facilities. It is well known that every gallon produced increases health costs in society, but there is a lot of argument over how much health costs increase. In reality the number is that health costs increase by $3 per gallon produced, but that it hard to discover. If the government does not intervene in this market, what will be the total surplus for society in this market (including the $3 per gallon health costs)? Please do not round at any step of any calculation. Do not round your final answer.arrow_forwardExplain the terms necessary and sufficient, in terms of a farmer seeking to maximize profits in the feeding of dairy cattle for milk production.arrow_forwardPA #1: Africa Apricots & The Apricot ValleyTwo apricot orchards African Apricots and The Apricot Valley sell seasonal apricots to the market. Assume that those apricots are both grown using the same organic practices in the neighboring orchards and do not differ in taste, size, color, or any other characteristics.The market demand is described by the following function: P=AB-Q. P is the price given per one bushel of apricots (a variable), Q is the quantity demanded at each price (a variable). Assume that both orchards have marginal costs that equal C $/bushel. A=1, B=9, and C=3 are the integer numbers given to you. 1.1. Write down the Demand function substituting A, B, and C with the given integer numbers. 1.2. Utilize the Cournot Model and find the Cournot-Nash Equilibrium for this oligopoly market. Demonstrate your algebraic solution. 1.3. Graph the best-response-function (reaction function) diagram for the companies. Demonstrate how you calculated the numbers that represent the…arrow_forward
- Please read the article attached below titled “Notable & Quotable: Gouging” (March 31, 2020) and answer the given question. Note: The phrase “price-gouging” refers to a situation where some sellers are charging prices (e.g., for health equipment and supplies) that are well above the market price charged by other sellers. If firms are reluctant to raise prices and/or earn an economic profit in response to the coronavirus outbreak, explain why the usual mechanism for achieving “allocative” (or social) economic efficiency in a perfectly competitive industry breaks down. What does Professor Romer recommend to improve “allocative” efficiency during this extraordinary time of a pandemic? In your answer, be sure to explain what economists mean by “allocative” efficiency.arrow_forwardRapel Valley in Chile is renowned for its ability to produce high-quality wine at a fraction of the cost of many other vineyards around the world. Rapel Valley produces over 20 million bottles of wine annually, of which 5 million are exported to the United States. Each bottle entering the United States is subjected to a $0.50 per bottle excise tax, which generates about $2.5 million in tax revenues. Strong La Niña weather patterns have caused unusually cold temperatures, devastating many of the wine producers in that region of Chile. How will La Niña affect the price of Chilean wine? Assuming La Niña does not impact the California wine-producing region, how will La Niña impact the market for Californian wines?arrow_forwardTable 3 given in the following page describes the long run cost schedules for a typical firm in a given industry operating under perfect competition and without positive or negative external economies. Table 4 gives the demand schedule for the product of this industry. a) Fill out the missing entries in the table b) Plot the long run average total cost and marginal cost curves for the typical firm. Plot the supply curve for the typical firm on a second diagram. Plot the demand schedule for the whole industry on a third diagram. c) Currently the number of firms in the industry is 16. They all enjoy the same cost schedules given in Table 3. What is the equilibrium price? (Hint construct the market supply curve and plot it on the same diagram as the demand curve) d) What will happen to the number of firms in the long run? What are the basic economic forces and the characteristics of competitive markets that justify your answer? e) What is the long run equilibrium price and long run…arrow_forward

 Principles of Economics (12th Edition)EconomicsISBN:9780134078779Author:Karl E. Case, Ray C. Fair, Sharon E. OsterPublisher:PEARSON
 Engineering Economy (17th Edition)EconomicsISBN:9780134870069Author:William G. Sullivan, Elin M. Wicks, C. Patrick KoellingPublisher:PEARSON
 Principles of Economics (MindTap Course List)EconomicsISBN:9781305585126Author:N. Gregory MankiwPublisher:Cengage Learning
 Managerial Economics: A Problem Solving ApproachEconomicsISBN:9781337106665Author:Luke M. Froeb, Brian T. McCann, Michael R. Ward, Mike ShorPublisher:Cengage Learning
 Managerial Economics & Business Strategy (Mcgraw-...EconomicsISBN:9781259290619Author:Michael Baye, Jeff PrincePublisher:McGraw-Hill Education