Concept explainers
Videos
To create:
A file that has two lines with n numbers in each and use subplot to show the barh and stacked bar charts side by side.
Answer to Problem 12.1P
Solution:
The script file is,
l = load('ponits.dat');
%load the points data file.
subplot(2, 1, 1)
%by using subplot show the bar graph and stacked bar graph side by side.
barh(l);
%plot the bar graph.
xlabel('Values');
%label the x axis as values.
ylabel('Groups');
%label the y axis as values.
subplot(2, 1, 2)
bar(l,'stacked');
%plot the stacked bar.
xlabel('Groups');
%label the x axis as groups.
ylabel('Values');
%label the y axis as values.
Explanation of Solution
Consider, the
MATLAB Code:
l = load('ponits.dat');
%load the points data file.
subplot(2, 1, 1)
%by using subplot show the bar graph and stacked bar graph side by side.
barh(l);
%plot the bar graph.
xlabel('Values');
%label the x axis as values.
ylabel('Groups');
%label the y axis as values.
subplot(2, 1, 2)
bar(l,'stacked');
%plot the stacked bar.
xlabel('Groups');
%label the x axis as groups.
ylabel('Values');
%label the y axis as values.
Save the MATLAB files with name, chapter12_54793_12_1P.m in the current folder. Execute the file by typing the name at the command window to generate output.
Result:
The plot is,
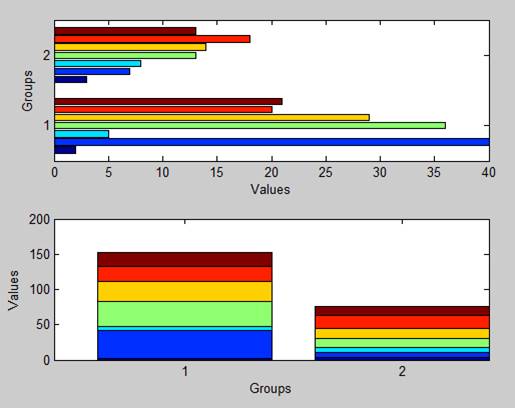
Therefore, the result is stated above.
Want to see more full solutions like this?
Chapter 12 Solutions
MATLAB: A Practical Introduction to Programming and Problem Solving


 Glencoe Algebra 1, Student Edition, 9780079039897...AlgebraISBN:9780079039897Author:CarterPublisher:McGraw Hill
 Trigonometry (MindTap Course List)TrigonometryISBN:9781337278461Author:Ron LarsonPublisher:Cengage Learning
 Holt Mcdougal Larson Pre-algebra: Student Edition...AlgebraISBN:9780547587776Author:HOLT MCDOUGALPublisher:HOLT MCDOUGAL