
Cornerstones of Cost Management (Cornerstones Series)
4th Edition
ISBN: 9781305970663
Author: Don R. Hansen, Maryanne M. Mowen
Publisher: Cengage Learning
expand_more
expand_more
format_list_bulleted
Videos
Textbook Question
Chapter 14, Problem 1CE
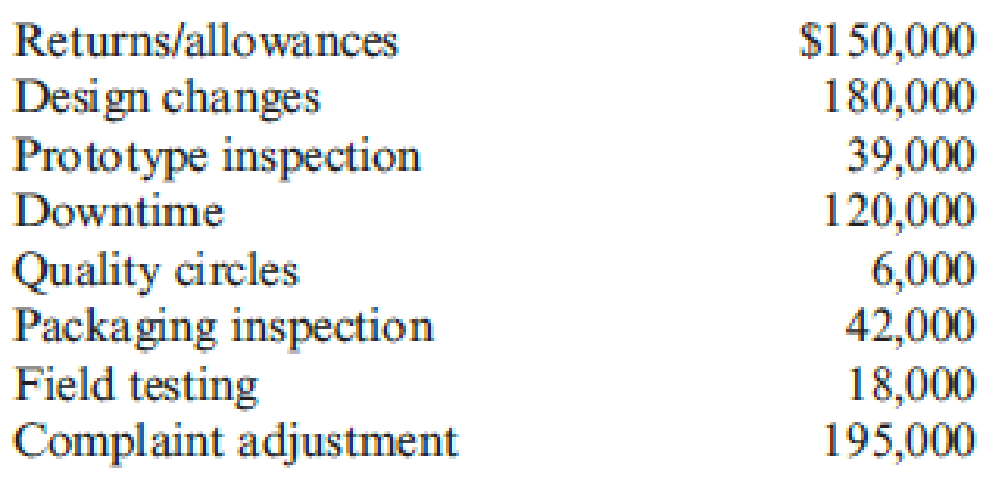
Evans Company had total sales of $3,000,000 for fiscal 20x5. The costs of quality-related activities are given below.
Required:
- 1. Prepare a quality cost report, classifying costs by category and expressing each category as a percentage of sales. What message does the cost report provide?
- 2. Prepare a bar graph and pie chart that illustrate each category’s contribution to total quality costs. Comment on the significance of the distribution.
- 3. What if, five years from now, quality costs are 7.5 percent of sales, with control costs being 65 percent of the total quality costs? What would your conclusion be?
Expert Solution & Answer

Trending nowThis is a popular solution!

Students have asked these similar questions
Cost of Quality and Value-Added/Non-Value-Added
Reports for a Service Company
Three Rivers Inc. provides cable TV and Internet service to the local community. The activities and activity costs of Three Rivers are identified as follows:
a. Identify the cost of quality classification for each activity and whether the activity is value-added or non-value-added.
Value-Added/
Non-Value-Added
Classification
Quality Control Activities
Billing error correction
Cable signal testing
Reinstalling service (installed incorrectly the first
time)
Repairing satellite equipment
Repairing underground cable connections to the
customer
Replacing old technology cable with higher
quality cable
Replacing old technology signal switches with
higher quality switches
Responding to customer home repair requests
Training employees
Total activity cost
Activity
Cost
$35,400
108,800
76,000
34,000
23,000
151,400
173,000
42,400
36,000
$680,000
Quality Cost
Classification
Max
A company has a linear total cost function and has determined that over the next three months it can produce12,000 units at a total cost of $224; 000. This same manufacturer can produce 18,000 units at a total cost of$296; 000. The selling price per unit is $13.25.i. Determine the revenue, cost and pro
t functions using q for number of units.ii. What is the
xed cost ?iii. What is the marginal cost ?iv. Find the break-even quantity.v. What is the break-even dollar volume of sale ?vi. What will pro
t be if the company shuts down operation?vii. If, because of a strike, the company will be able to produce only 10,000 units, should it shut down for the nextthree months ? why or why not ?
Rongon Company manufactures twotypes of product. Selected information is given below:FantasyJoySelling price per unit$25$150Variable expenses per unit$15$35Number of units sold annually20,0005,000Fixed expenses total $480,800 per year. Required: i.Assuming the sales mix given above, do the following: a. Prepare a contribution format income statement showing both dollar and percent columns for each product and for the company as a
whole. b. Compute the break-even point in dollars for the company as awhole and the margin of safety in both dollars and percent.ii.The company has developed a new product to be called Delight. Assume that the company could sell 10,000 units at $65each. The variable expenses would be $58each. The company’s fixed expenses would not change. a. Prepare another contribution format income statement, including sales of the Samoan Delight (sales of the other two products would not change). b. Compute the company’s new break-even point in dollars and the new margin…
Chapter 14 Solutions
Cornerstones of Cost Management (Cornerstones Series)
Ch. 14 - What is the difference between quality of design...Ch. 14 - Why are quality costs the costs of doing things...Ch. 14 - Prob. 3DQCh. 14 - Describe the Taguchi quality loss function, and...Ch. 14 - Identify and discuss the four kinds of quality...Ch. 14 - Explain why external failure costs can be more...Ch. 14 - Prob. 7DQCh. 14 - Prob. 8DQCh. 14 - Describe the three types of quality performance...Ch. 14 - Prob. 10DQ
Ch. 14 - If a firms annual sales are 200 million, what...Ch. 14 - Explain why it is important for a manager to...Ch. 14 - Prob. 13DQCh. 14 - Explain why the Accounting Department should be...Ch. 14 - Prob. 15DQCh. 14 - What is ecoefficiency?Ch. 14 - Prob. 17DQCh. 14 - Prob. 18DQCh. 14 - Prob. 19DQCh. 14 - What are the four categories of environmental...Ch. 14 - Prob. 21DQCh. 14 - What does full environmental costing mean? Full...Ch. 14 - What information is communicated by the unit...Ch. 14 - Evans Company had total sales of 3,000,000 for...Ch. 14 - Prob. 2CECh. 14 - Ross Company implemented a quality improvement...Ch. 14 - Nabors Company had actual quality costs for the...Ch. 14 - Verde Company reported operating costs of...Ch. 14 - Pinter Company had the following environmental...Ch. 14 - Rachel Boyce, president of a company that...Ch. 14 - Quality attributes such as performance and...Ch. 14 - Stahman, Inc., estimates its hidden external...Ch. 14 - Prob. 10ECh. 14 - Abernathy, Inc., produces two different generators...Ch. 14 - Kang Company reported sales of 3,240,000 in 20x5....Ch. 14 - Gagnon Company reported the following sales and...Ch. 14 - Muskogee Company had sales of 60,000,000 in 20x1....Ch. 14 - Javier Company has sales of 8 million and quality...Ch. 14 - In 20x4, Tru-Delite Frozen Desserts, Inc.,...Ch. 14 - Prob. 17ECh. 14 - Prob. 18ECh. 14 - Achieving sustainable development will likely...Ch. 14 - Classify the following environmental activities as...Ch. 14 - At the end of 20x5, Bing Pharmaceuticals began to...Ch. 14 - Prob. 22ECh. 14 - Coyle Pharmaceuticals produces two organic...Ch. 14 - Prob. 24ECh. 14 - Which of the following quality costs is an...Ch. 14 - Which of the following would be a hidden quality...Ch. 14 - Using the Taguchi quality loss function, an...Ch. 14 - Environmental costs are those costs incurred...Ch. 14 - Two products, Product A and Product B, are...Ch. 14 - Kathy Shorts, president of Oliver Company, was...Ch. 14 - Panguitch Company manufactures a component for...Ch. 14 - Gaston Company manufactures furniture. One of its...Ch. 14 - Classify the following quality costs as...Ch. 14 - Wayne Johnson, president of Banshee Company,...Ch. 14 - Recently, Ulrich Company received a report from an...Ch. 14 - In 20x5, Major Company initiated a full-scale,...Ch. 14 - Paper Products Division produces paper diapers,...Ch. 14 - In 2011, Milton Thayne, president of Carbondale...Ch. 14 - Iona Company, a large printing company, is in its...Ch. 14 - Prob. 40PCh. 14 - The following items are listed in an environmental...Ch. 14 - Refer to Problem 14.41. In the environmental...Ch. 14 - The following environmental cost reports for 20x3,...Ch. 14 - Refer to Problem 14.43. In 20x3, Jack Carter,...
Knowledge Booster


Learn more about
Need a deep-dive on the concept behind this application? Look no further. Learn more about this topic, accounting and related others by exploring similar questions and additional content below.Similar questions
- Pintura Company implemented a quality improvement program and tracked the following for the five years: By cost category as a percentage of sales for the same period of time: Required: 1. Prepare a bar graph that reveals the trend in quality cost as a percentage of sales (time on the horizontal axis and percentages on the vertical). Comment on the message of the graph. 2. Prepare a bar graph for each cost category as a percentage of sales. What does this graph tell you?arrow_forwardQuality Cost Report Loring Company had total sales of 2,400,000 for fiscal 20X1. The costs of quality-related activities are given below. Required: 1. Prepare a quality cost report, classifying costs by category and expressing each category as a percentage of sales. What message does the cost report provide? 2. Prepare a bar graph and pie chart that illustrate each categorys contribution to total quality costs. Comment on the significance of the distribution.arrow_forwardRoss Company implemented a quality improvement program and tracked the following for the five years: By cost category as a percentage of sales for the same period of time: Required: 1. Prepare a bar graph that reveals the trend in quality cost as a percentage of sales (time on the horizontal axis and percentages on the vertical). Comment on the message of the graph. 2. Prepare a bar graph for each cost category as a percentage of sales. What does this graph tell you? 3. What if management would like to have the trend in relative distribution of quality costs? Express this as a bar graph and comment on its significance.arrow_forward
- Quality Cost Report Whitley Company had total sales of 1,000,000 for the year ending 20X1. The costs of quality are given below. Required: 1. Prepare a quality cost report, classifying costs by category and expressing each category as a percentage of sales. What message does the cost report provide? 2. Prepare a bar graph and pie chart that illustrate each categorys contribution to total quality costs. Comment on the significance of the distribution.arrow_forwardBradshaw Company reported sales of 5,000,000 in 20X1. At the end of the fiscal year (June 30, 20X1), the following quality costs were reported: Required: 1. Prepare a quality cost report. 2. Prepare a graph (pie chart or bar graph) that shows the relative distribution of quality costs, and comment on the distribution. 3. Assuming sales of 5,000,000, by how much would profits increase if quality improves so that quality costs are only 3% of sales?arrow_forwardNorris Company implemented a quality improvement program and tracked the following for the 5 years: By cost category of sales for the same period of time: Required: 1. Prepare a bar graph (hat reveals the trend in quality cost as a percentage of sales (time on horizontal axis and percentages on the vertical). Comment on the message of the graph. 2. Prepare a bar graph for each cost category as a percentage of sales. What does this graph tell you?arrow_forward
- Kang Company reported sales of 3,240,000 in 20x5. At the end of the calendar year, the following quality costs were reported: Required: 1. Prepare a quality cost report. 2. Prepare a graph (pie chart or bar graph) that shows the relative distribution of quality costs, and comment on the distribution.arrow_forwardNabors Company had actual quality costs for the year ended June 30, 20x5, as given below. At the zero-defect state, Nabors expects to spend 375,000 on quality engineering, 75,000 on vendor certification, and 50,000 on packaging inspection. Assume sales to be 25,000,000. Required: 1. Prepare a long-range performance report for 20x5. What does this report tell the management of Nabors? 2. Explain why quality costs still are present for the zero-defect state. 3. What if Nabors achieves the zero-defect state reflected in the report? What are some of the implications of this achievement?arrow_forwardCost of Quality and Value-Added/Non-Value-Added Reports for a Service Company Three Rivers Inc. provides cable TV and Internet service to the local community. The activities and activity costs of Three Rivers are identified as follows: a. Identify the cost of quality classification for each activity and whether the activity is value-added or non-value-added. Value-Added/ Activity Quality Cost Non-Value-Added Quality Control Activities Cost Classification Classification Billing error correction $46,200 Cable signal testing 115,500 Reinstalling service (installed incorrectly the first 99,300 time) Repairing satellite equipment 46,200 Repairing underground cable connections to the 30,000 customer Replacing old technology cable with higher quality 158,500 cable Replacing old technology signal switches with 181,100 higher quality switches Responding to customer home repair requests 55,500 Training employees 37,700 Total activity cost $770,000arrow_forward
- Assume that a company uses the absorption costing approach to cost-plus pricing. It is considering the introduction of a new product. To determine a selling price, the company has gathered the following information: Number of units to be produced and sold each year 15,000 Unit product cost $ 30 Estimated annual selling and administrative expenses $ 68,400 Estimated investment required by the company $ 780,000 Desired return on investment (ROI) 12 % What is the markup percentage on absorption cost required to achieve the desired ROI? Multiple Choice 41% 46% 36% 31%arrow_forwardGrayson Industries manufactures freezers. Here is some information about its "LX17" line of freezers over the past year: (Click the icon to view the information.) Read the requirements. Requirement 1. Prepare a Cost of Quality (COQ) report. In addition to calculating the total costs of each category, calculate the percentage of COQ category of the total COQ. (Round the percentage to the one tenth of a percent, X.X% input field is not used in the table, leave the input field empty; do not select a label or enter a zero.) Grayson Cost of Quality Report Prevention Costs: Total prevention costs Appraisal Costs: Total appraisal costs Internal Failure Costs: Total internal failure costs External Failure Costs: Total external failure costs Total costs of quality Costs Incurred Total Costs of Percentage of Total Costs Quality of Quality (Rounded) % Data table % Requirements 1. Prepare a Cost of Quality (COQ) report. In addition to calculating the total costs of each category, calculate the…arrow_forwardThe cost data for Evencoat Paint for the year 2019 is as follows: Using the high-low method, express the companys maintenance costs as an equation where x represents the gallons of paint produced. Then estimate the fixed and variable costs. Predict the maintenance costs i190,000 gallons of paint are produced. Predict the maintenance costs if 81,000 gallons of paint are produced. Using Excel, create a scatter graph of the cost data and explain the relationship between gallons of paint produced and equipment maintenance expenses.arrow_forward
arrow_back_ios
SEE MORE QUESTIONS
arrow_forward_ios
Recommended textbooks for you
 Cornerstones of Cost Management (Cornerstones Ser...AccountingISBN:9781305970663Author:Don R. Hansen, Maryanne M. MowenPublisher:Cengage Learning
 Managerial Accounting: The Cornerstone of Busines...AccountingISBN:9781337115773Author:Maryanne M. Mowen, Don R. Hansen, Dan L. HeitgerPublisher:Cengage Learning
 Excel Applications for Accounting PrinciplesAccountingISBN:9781111581565Author:Gaylord N. SmithPublisher:Cengage Learning
 Principles of Cost AccountingAccountingISBN:9781305087408Author:Edward J. Vanderbeck, Maria R. MitchellPublisher:Cengage Learning
 Principles of Accounting Volume 2AccountingISBN:9781947172609Author:OpenStaxPublisher:OpenStax College
Cornerstones of Cost Management (Cornerstones Ser...
Accounting
ISBN:9781305970663
Author:Don R. Hansen, Maryanne M. Mowen
Publisher:Cengage Learning
Managerial Accounting: The Cornerstone of Busines...
Accounting
ISBN:9781337115773
Author:Maryanne M. Mowen, Don R. Hansen, Dan L. Heitger
Publisher:Cengage Learning
Excel Applications for Accounting Principles
Accounting
ISBN:9781111581565
Author:Gaylord N. Smith
Publisher:Cengage Learning
Principles of Cost Accounting
Accounting
ISBN:9781305087408
Author:Edward J. Vanderbeck, Maria R. Mitchell
Publisher:Cengage Learning
Principles of Accounting Volume 2
Accounting
ISBN:9781947172609
Author:OpenStax
Publisher:OpenStax College
Inspection and Quality control in Manufacturing. What is quality inspection?; Author: Educationleaves;https://www.youtube.com/watch?v=Ey4MqC7Kp7g;License: Standard youtube license