
Videos
1.
Calculate the relative distribution of quality costs for each year and prepare a pie chart and find out whether the company is moving in a right direction in terms of the balance among the quality cost management.
1.
Explanation of Solution
Total Quality Management: Total Quality Management is a method that eliminates wasteful activities and improves quality throughout the value chain by allocating quality management responsibility, rewarding low-cost, high-quality results and monitoring quality costs.
Quality costs: Quality costs are costs that are incurred to avoid, identify and eliminate defects from products. Quality costs are classified into four components namely;
- 1. “Prevention costs”.
- 2. “Appraisal costs”.
- 3. “Internal failure costs”.
- 4. “External failure costs”.
For the year 2014:
Calculate the cost-to-sales ratio for appraisal cost:
Therefore, the cost-to-sales ratio for appraisal cost is 17.6%.
Calculate the cost-to-sales ratio for prevention cost:
Therefore, the cost-to-sales ratio for prevention cost is 0.4%.
Calculate the cost-to-sales ratio for internal failure cost:
Therefore, the cost-to-sales ratio for internal failure cost is 48.8%.
Calculate the cost-to-sales ratio for external failure cost:
Therefore, the cost-to-sales ratio for external failure cost is 33.2%.
Prepare pie chart for the year 2014:
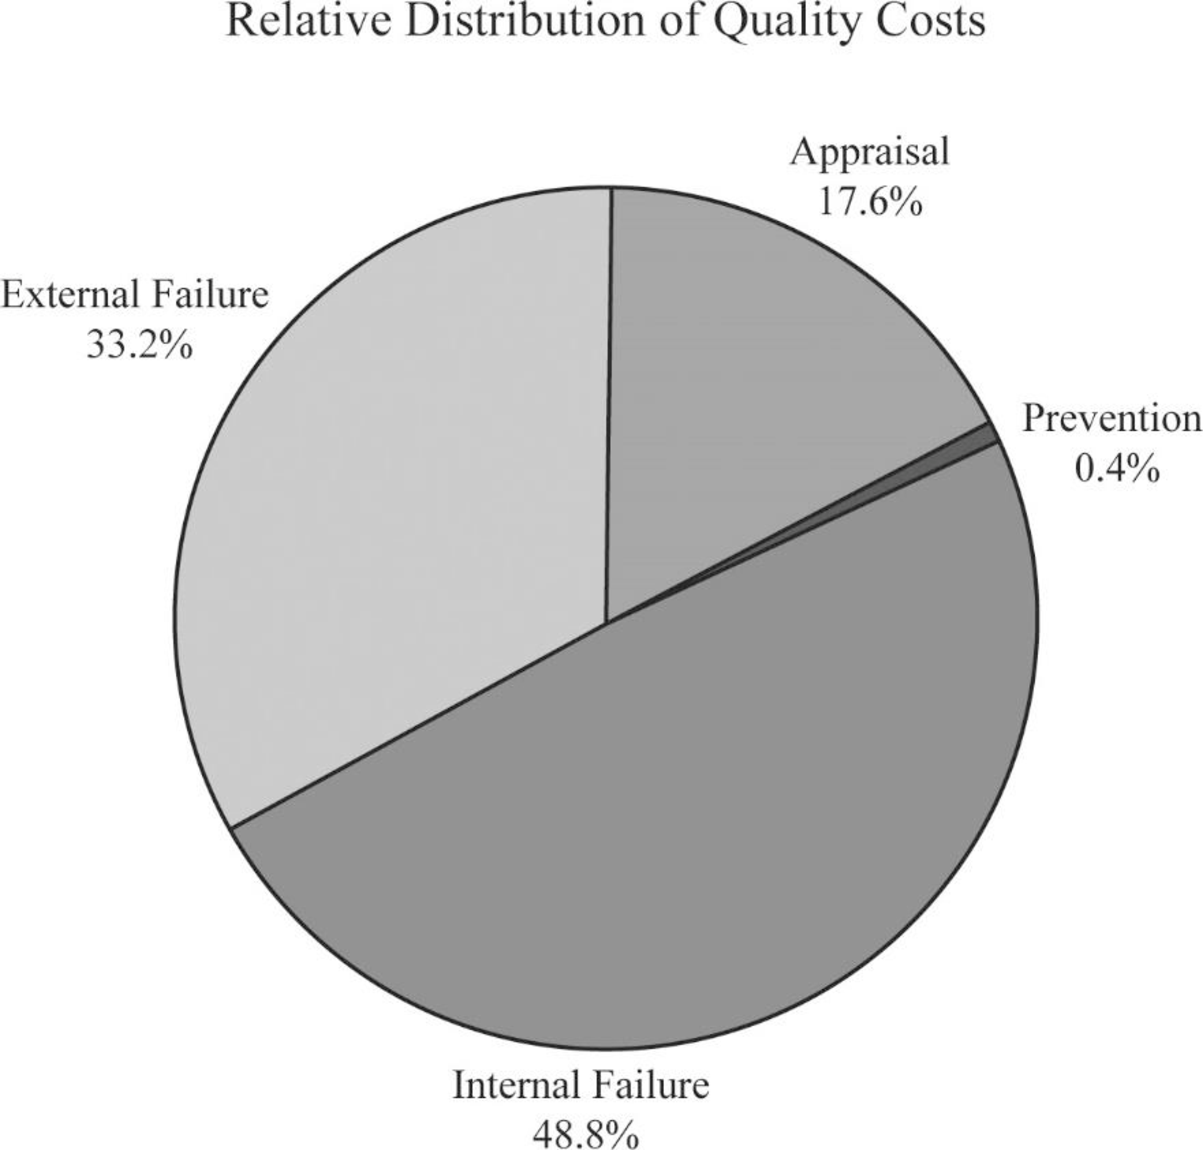
Figure (1)
For the year 2015:
Calculate the cost-to-sales ratio for appraisal cost:
Therefore, the cost-to-sales ratio for appraisal cost is 17.6%.
Calculate the cost-to-sales ratio for prevention cost:
Therefore, the cost-to-sales ratio for prevention cost is 0.4%.
Calculate the cost-to-sales ratio for internal failure cost:
Therefore, the cost-to-sales ratio for internal failure cost is 48.8%.
Calculate the cost-to-sales ratio for external failure cost:
Therefore, the cost-to-sales ratio for external failure cost is 33.2%.
Prepare pie chart for the year 2015:
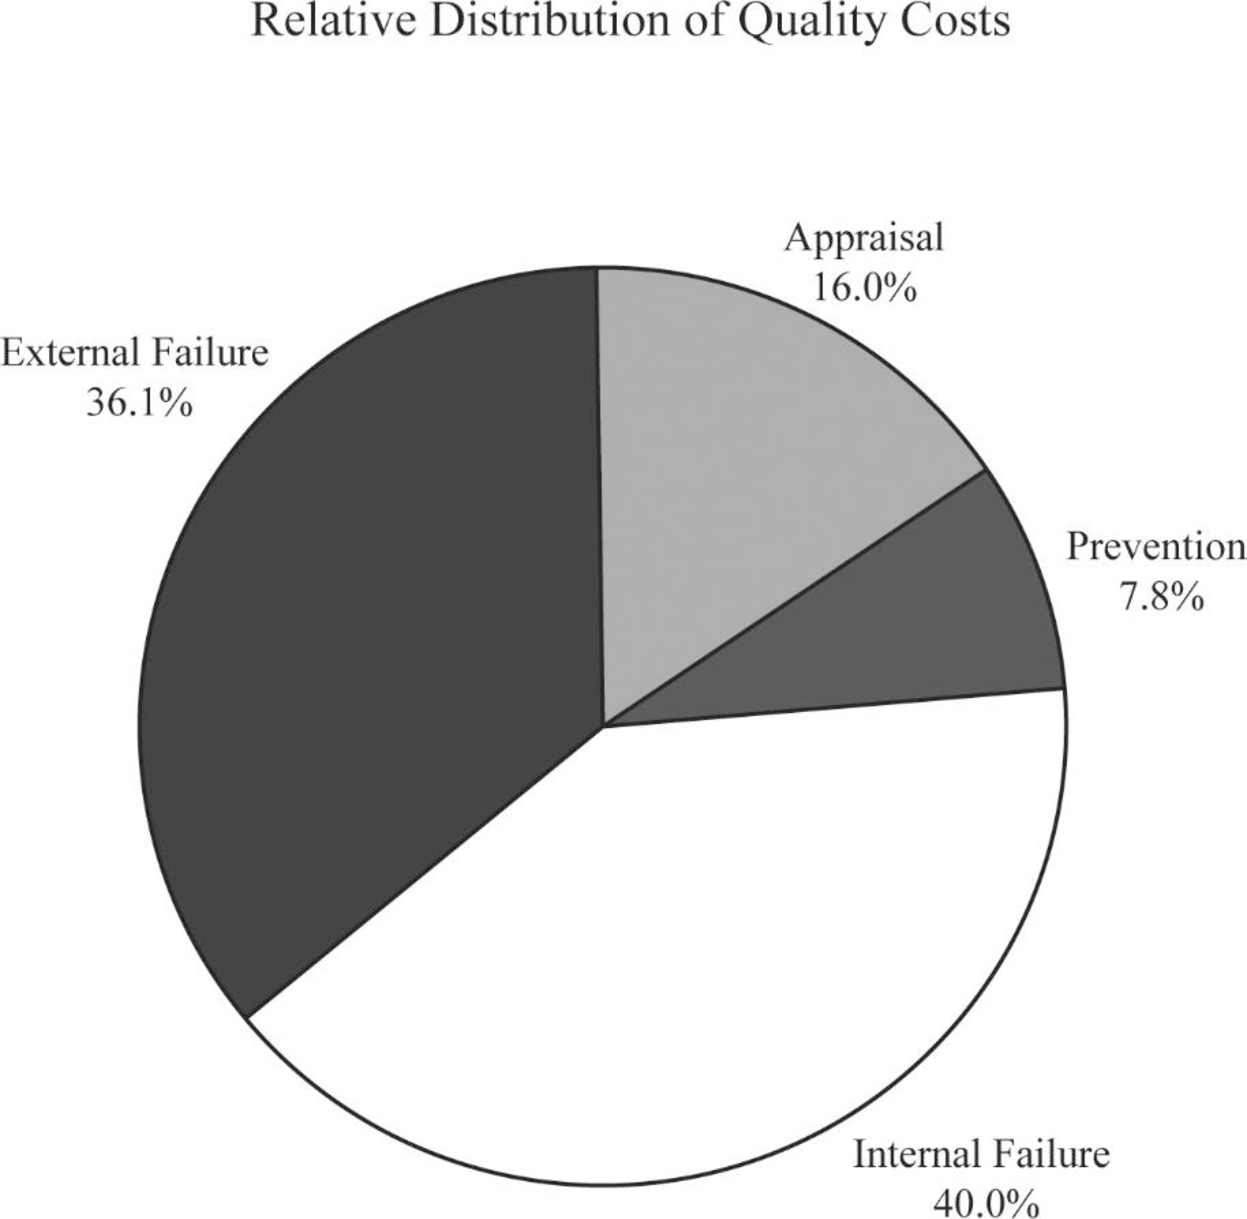
Figure (2)
Yes. Additional effort is required for “prevention and appraisal activities”. The movement is in that direction, and total failure costs is been decreased.
2.
Prepare a one-year performance report for 2015 and find out the amount of profits increased sue the quality improvements made by Company M.
2.
Explanation of Solution
Long-range performance report: Long-range performance report compares the “current actual” with the costs that will be allowed if the “zero-defects standard” is being met by assuming that sales level is equal to that of the existing period.
Prepare a one-year performance report for 2015:
| Company M | ||||
| Performance Report | ||||
| One-Year Trend | ||||
| Particulars |
Actual Costs 2015 (a) |
Actual Costs 2014 (b) |
Variance | |
| Prevention costs | ||||
| Quality circles (F) | $40,000 | $4,000 | ($36,000) | U |
| Design reviews(F) | $20,000 | $2,000 | ($18,000) | U |
| Improvement projects(F) | $100,000 | $2,000 | ($98,000) | U |
| Total prevention costs | $160,000 | $8,000 | ($152,000) | U |
| Appraisal costs: | ||||
| Packaging inspection(V) | $300,000 | (1)$400,000 | $100,000 | F |
| Product acceptance(V) | $28,000 | (2)$50,000 | $22,000 | F |
| Total appraisal costs | $328,000 | $450,000 | $122,000 | F |
| Internal failure costs: | ||||
| Scrap(V) | $240,000 | (3)$350,000 | $110,000 | F |
| Rework(V) | $320,000 | (4)$450,000 | $130,000 | F |
| Yield losses (V) | $100,000 | (5)$200,000 | $100,000 | F |
| Retesting (V) | $160,000 | (6)$250,000 | $90,000 | F |
| Total internal failure costs | $820,000 | $1,250,000 | $430,000 | F |
| External failure costs: | ||||
| Returned materials (V) | $160,000 | (7)$200,000 | $40,000 | F |
| Allowances (V) | $140,000 | (8)$150,000 | $10,000 | F |
| Warranty (V) | $440,000 | (9)$500,000 | $60,000 | F |
| Total external failure costs | $740,000 | $850,000 | $110,000 | F |
| Total quality costs | $2,048,000 | $2,558,000 | $510,000 | F |
Table (1)
For comparing the costs of 2015 with costs of 2014, the costs for 2014 should be adjusted to a sales level of $10 million. Therefore, all variable costs will vary from the 2014 levels. For instance, the adjusted product packaging inspection cost is $400,000(1).
Working notes:
(1)Calculate the actual costs of packaging inspection:
(2)Calculate the actual costs of product acceptance:
(3)Calculate the actual costs of scrap:
(4)Calculate the actual costs of rework:
(5)Calculate the actual costs of yield losses:
(6)Calculate the actual costs of retesting:
(7)Calculate the actual costs of returned materials:
(8)Calculate the actual costs of returned allowances:
(9)Calculate the actual costs of returned warranty:
3.
Estimate the additional improvement in profits if Company M reduces its quality costs to 2.5 percent of sales revenue.
3.
Explanation of Solution
Calculate the additional improvements in profits:
Therefore, the additional improvements in profits are $1,798,000.
Want to see more full solutions like this?
Chapter 14 Solutions
Cornerstones of Cost Management (Cornerstones Series)


- In 2011, Milton Thayne, president of Carbondale Electronics, received a report indicating that quality costs were 31 percent of sales. Faced with increasing pressures from imported goods, Milton resolved to take measures to improve the overall quality of the companys products. After hiring a consultant in 20x0, the company began an aggressive program of total quality control. At the end of 20x5, Milton requested an analysis of the progress the company had made in reducing and controlling quality costs. The Accounting Department assembled the following data: Required: 1. Compute the quality costs as a percentage of sales by category and in total for each year. 2. Prepare a multiple-year trend graph for quality costs, both by total costs and by category. Using the graph, assess the progress made in reducing and controlling quality costs. Does the graph provide evidence that quality has improved? Explain. 3. Using the 20x1 quality cost relationships (assume all costs are variable), calculate the quality costs that would have prevailed in 20x4. By how much did profits increase in 20x4 because of the quality improvement program? Repeat for 20x5.arrow_forwardRecently, Ulrich Company received a report from an external consulting group on its quality costs. The consultants reported that the companys quality costs total about 21 percent of its sales revenues. Somewhat shocked by the magnitude of the costs, Rob Rustin, president of Ulrich Company, decided to launch a major quality improvement program. For the coming year, management decided to reduce quality costs to 17 percent of sales revenues. Although the amount of reduction was ambitious, most company officials believed that the goal could be realized. To improve the monitoring of the quality improvement program, Rob directed Pamela Golding, the controller, to prepare monthly performance reports comparing budgeted and actual quality costs. Budgeted costs and sales for the first two months of the year are as follows: The following actual sales and actual quality costs were reported for January: Required: 1. Reorganize the monthly budgets so that quality costs are grouped in one of four categories: appraisal, prevention, internal failure, or external failure. (Essentially, prepare a budgeted cost of quality report.) Also, identify each cost as variable (V) or fixed (F). (Assume that no costs are mixed.) 2. Prepare a performance report for January that compares actual costs with budgeted costs. Comment on the companys progress in improving quality and reducing its quality costs.arrow_forwardIn 20X1, Don Blackburn, president of Price Electronics, received a report indicating that quality costs were 31% of sales. Faced with increasing pressures from imported goods. Don resolved to take measures to improve the overall quality of the companys products. After hiring a consultant in 20X1, the company began an aggressive program of total quality control. At the end of 20X5, Don requested an analysis of the progress the company had made in reducing and controlling quality costs. The accounting department assembled the following data: Required: 1. Compute the quality costs as a percentage of sales by category and in total for each year. 2. Prepare a multiple-year trend graph for quality costs, both by total costs and by category. Using the graph, assess the progress made in reducing and controlling quality costs. Does the graph provide evidence that quality has improved? Explain. 3. Using the 20X1 quality cost relationships (assume all costs are variable), calculate the quality costs that would have prevailed in 20X4. By how much did profits increase in 20X4 because of the quality improvement program? Repeat for 20X5.arrow_forward
- At the end of 2021, Mejorar Company implemented a low-cost strategy to improve its competitive position. Its objective was to become the low-cost producer in its industry. A Balanced Scorecard was developed to guide the company toward this objective. To lower costs, Mejorar undertook a number of improvement activities such as JIT production, total quality management, and activity-based management. Now, after two years of operation, the president of Mejorar wants some assessment of the achievements. To help provide this assessment, the following information on one product has been gathered: 1. Compute the following measures for 2021 and 2023: a. actual velocity and cycle time (2021 and 2023) (My question: In the book it stated that Actual Velocity (# units produced/time) and Cycle Time (time/# units produced) However, which one is per hour and per minute Or maybe I wrong let me know?) b. Percentage of total revenue from new customers (2021 and 2023) (assume one unit per customer) c.…arrow_forwardHoward Rockness was worried. His company, Rockness Bottling, showed declining profits over the past several years despite an increase in revenues. With profits declining and revenues increasing, Rockness knew there must be a problem with costs. Rockness sent an e-mail to his executive team under the subject heading, “How do we get Rockness Bottling back on track?” Meeting in Rockness’s spacious office, the team began brainstorming solutions to the declining profits problem. Some members of the team wanted to add products. (These were marketing people.) Some wanted to fire the least efficient workers. (These were finance people.) Some wanted to empower the workers. (These people worked in the human resources department.) And some people wanted to install a new computer system. (It should be obvious who these people were.) Rockness listened patiently. When all participants had made their cases, Rockness said, “We made money when we were a smaller, simpler company. We have grown,…arrow_forwardHoward Rockness was worried. His company, Rockness Bottling, showed declining profits over the past several years despite an increase in revenues. With profits declining and revenues increasing, Rockness knew there must be a problem with costs. Rockness sent an e-mail to his executive team under the subject heading, “How do we get Rockness Bottling back on track?” Meeting in Rockness’s spacious office, the team began brainstorming solutions to the declining profits problem. Some members of the team wanted to add products. (These were marketing people.) Some wanted to fire the least efficient workers. (These were finance people.) Some wanted to empower the workers. (These people worked in the human resources department.) And some people wanted to install a new computer system. (It should be obvious who these people were.) Rockness listened patiently. When all participants had made their cases, Rockness said, “We made money when we were a smaller, simpler company. We have grown, added…arrow_forward
- Lindell Manufacturing embarked on an ambitious quality program that is centered on continual improvement. This improvement is operationalized by declining quality costs from year toyear. Lindell rewards plant managers, production supervisors, and workers with bonuses ranging from $1,000 to $10,000 if their factory meets its annual quality cost goals.Len Smith, manager of Lindell’s Boise plant, felt obligated to do everything he could toprovide this increase to his employees. Accordingly, he has decided to take the following actionsduring the last quarter of the year to meet the plant’s budgeted quality cost targets:a. Decrease inspections of the process and final product by 50% and transfer inspectorstemporarily to quality training programs. Len believes this move will increase theinspectors’ awareness of the importance of quality; also, decreasing inspection willproduce significantly less downtime and less rework. By increasing the output anddecreasing the costs of internal failure,…arrow_forwardIn response to intensive foreign competition, the management of Florex Company has attempted over the past year to improve the quality of its products. A statistical process control system has been installed and other steps have been taken to decrease the amount of warranty and other field costs, which have been trending upward over the past several years. Costs relating to quality and quality control over the last two years are given below: Costs (in thousands) Last This Year Year $ 1,584 Inspection Quality engineering Depreciation of test eguipment 765 540 675 630 225 $ 1,260 $ 1,620 225 Rework labor Statistical process control Cost of field servicing $ 1,710 1,170 81 Supplies used in testing Systems development Warranty repairs Net cost of scrap Product testing Product recalls 45 630 900 1,260 24 4,140 1,530 $ 1,440 990 540 900 $ 2,700 900 Disposal of defective products 900 Sales have been flat over the past few years, at $90,000,000 per year. A great deal of money has been spent in…arrow_forwardKathy Shorts, president of Oliver Company, was concerned with the trend in sales and profitability. The company had been losing customers at an alarming rate. Furthermore, the company was barely breaking even. Investigation revealed that poor quality was at the root of the problem. At the end of 20x5, Kathy decided to begin a quality improvement program. As a first step, she identified the following costs in the accounting records as quality related: Required: 1. Prepare a quality cost report by quality cost category. 2. Calculate the relative distribution percentages for each quality cost category. Comment on the distribution. 3. Using the Taguchi loss function, an average loss per unit is computed to be 15 per unit. What are the hidden costs of external failure? How does this affect the relative distribution? 4. Shortss quality manager decided not to bother with the hidden costs. What do you think was his reasoning? Any efforts to reduce measured external failure costs will also reduce the hidden costs. Do you agree or disagree? Explain.arrow_forward
- At the beginning of the last quarter of 20x1, Youngston, Inc., a consumer products firm, hired Maria Carrillo to take over one of its divisions. The division manufactured small home appliances and was struggling to survive in a very competitive market. Maria immediately requested a projected income statement for 20x1. In response, the controller provided the following statement: After some investigation, Maria soon realized that the products being produced had a serious problem with quality. She once again requested a special study by the controllers office to supply a report on the level of quality costs. By the middle of November, Maria received the following report from the controller: Maria was surprised at the level of quality costs. They represented 30 percent of sales, which was certainly excessive. She knew that the division had to produce high-quality products to survive. The number of defective units produced needed to be reduced dramatically. Thus, Maria decided to pursue a quality-driven turnaround strategy. Revenue growth and cost reduction could both be achieved if quality could be improved. By growing revenues and decreasing costs, profitability could be increased. After meeting with the managers of production, marketing, purchasing, and human resources, Maria made the following decisions, effective immediately (end of November 20x1): a. More will be invested in employee training. Workers will be trained to detect quality problems and empowered to make improvements. Workers will be allowed a bonus of 10 percent of any cost savings produced by their suggested improvements. b. Two design engineers will be hired immediately, with expectations of hiring one or two more within a year. These engineers will be in charge of redesigning processes and products with the objective of improving quality. They will also be given the responsibility of working with selected suppliers to help improve the quality of their products and processes. Design engineers were considered a strategic necessity. c. Implement a new process: evaluation and selection of suppliers. This new process has the objective of selecting a group of suppliers that are willing and capable of providing nondefective components. d. Effective immediately, the division will begin inspecting purchased components. According to production, many of the quality problems are caused by defective components purchased from outside suppliers. Incoming inspection is viewed as a transitional activity. Once the division has developed a group of suppliers capable of delivering nondefective components, this activity will be eliminated. e. Within three years, the goal is to produce products with a defect rate less than 0.10 percent. By reducing the defect rate to this level, marketing is confident that market share will increase by at least 50 percent (as a consequence of increased customer satisfaction). Products with better quality will help establish an improved product image and reputation, allowing the division to capture new customers and increase market share. f. Accounting will be given the charge to install a quality information reporting system. Daily reports on operational quality data (e.g., percentage of defective units), weekly updates of trend graphs (posted throughout the division), and quarterly cost reports are the types of information required. g. To help direct the improvements in quality activities, kaizen costing is to be implemented. For example, for the year 20x1, a kaizen standard of 6 percent of the selling price per unit was set for rework costs, a 25 percent reduction from the current actual cost. To ensure that the quality improvements were directed and translated into concrete financial outcomes, Maria also began to implement a Balanced Scorecard for the division. By the end of 20x2, progress was being made. Sales had increased to 26,000,000, and the kaizen improvements were meeting or beating expectations. For example, rework costs had dropped to 1,500,000. At the end of 20x3, two years after the turnaround quality strategy was implemented, Maria received the following quality cost report: Maria also received an income statement for 20x3: Maria was pleased with the outcomes. Revenues had grown, and costs had been reduced by at least as much as she had projected for the two-year period. Growth next year should be even greater as she was beginning to observe a favorable effect from the higher-quality products. Also, further quality cost reductions should materialize as incoming inspections were showing much higher-quality purchased components. Required: 1. Identify the strategic objectives, classified by the Balanced Scorecard perspective. Next, suggest measures for each objective. 2. Using the results from Requirement 1, describe Marias strategy using a series of if-then statements. Next, prepare a strategy map. 3. Explain how you would evaluate the success of the quality-driven turnaround strategy. What additional information would you like to have for this evaluation? 4. Explain why Maria felt that the Balanced Scorecard would increase the likelihood that the turnaround strategy would actually produce good financial outcomes. 5. Advise Maria on how to encourage her employees to align their actions and behavior with the turnaround strategy.arrow_forwardLindell Manufacturing embarked on an ambitious quality program that is centered on continual improvement. This improvement is operationalized by declining quality costs from year to year. Lindell rewards plant managers, production supervisors, and workers with bonuses ranging from 1,000 to 10,000 if their factory meets its annual quality cost goals. Len Smith, manager of Lindells Boise plant, felt obligated to do everything he could to provide this increase to his employees. Accordingly, he has decided to take the following actions during the last quarter of the year to meet the plants budgeted quality cost targets: a. Decrease inspections of the process and final product by 50% and transfer inspectors temporarily to quality training programs. Len believes this move will increase the inspectors awareness of the importance of quality; also, decreasing inspection will produce significantly less downtime and less rework. By increasing the output and decreasing the costs of internal failure, the plant can meet the budgeted reductions for internal failure costs. Also, by showing an increase in the costs of quality training, the budgeted level for prevention costs can be met. b. Delay replacing and repairing defective products until the beginning of the following year. While this may increase customer dissatisfaction somewhat, Len believes that most customers expect some inconvenience. Besides, the policy of promptly dealing with customers who are dissatisfied could be reinstated in 3 months. In the meantime, the action would significantly reduce the costs of external failure, allowing the plant to meet its budgeted target. c. Cancel scheduled worker visits to customers plants. This program, which has been very well received by customers, enables Lindell workers to see just how the machinery they make is used by the customer and also gives them first-hand information on any remaining problems with the machinery. Workers who went on previous customer site visits came back enthusiastic and committed to Lindells quality program. Lindells quality program staff believes that these visits will reduce defects during the following year. Required: 1. Evaluate Lens ethical behavior. In this evaluation, consider his concern for his employees. Was he justified in taking the actions described? If not, what should he have done? 2. Assume that the company views Lens behavior as undesirable. What can the company do to discourage it? 3. Assume that Len is a CMA and a member of the IMA. Refer to the ethical code for management accountants in Chapter 1. Were any of these ethical standards violated?arrow_forwardGagnon Company reported the following sales and quality costs for the past four years. Assume that all quality costs are variable and that all changes in the quality cost ratios are due to a quality improvement program. Required: 1. Compute the quality costs for all four years. By how much did net income increase from Year 1 to Year 2 because of quality improvements? From Year 2 to Year 3? From Year 3 to Year 4? 2. The management of Gagnon Company believes it is possible to reduce quality costs to 2.5 percent of sales. Assuming sales will continue at the Year 4 level, calculate the additional profit potential facing Gagnon. Is the expectation of improving quality and reducing costs to 2.5 percent of sales realistic? Explain. 3. Assume that Gagnon produces one type of product, which is sold on a bid basis. In Years 1 and 2, the average bid was 400. In Year 1, total variable costs were 250 per unit. In Year 3, competition forced the bid to drop to 380. Compute the total contribution margin in Year 3 assuming the same quality costs as in Year 1. Now, compute the total contribution margin in Year 3 using the actual quality costs for Year 3. What is the increase in profitability resulting from the quality improvements made from Year 1 to Year 3?arrow_forward
 Cornerstones of Cost Management (Cornerstones Ser...AccountingISBN:9781305970663Author:Don R. Hansen, Maryanne M. MowenPublisher:Cengage Learning
 Managerial Accounting: The Cornerstone of Busines...AccountingISBN:9781337115773Author:Maryanne M. Mowen, Don R. Hansen, Dan L. HeitgerPublisher:Cengage Learning