
Concept explainers
Videos
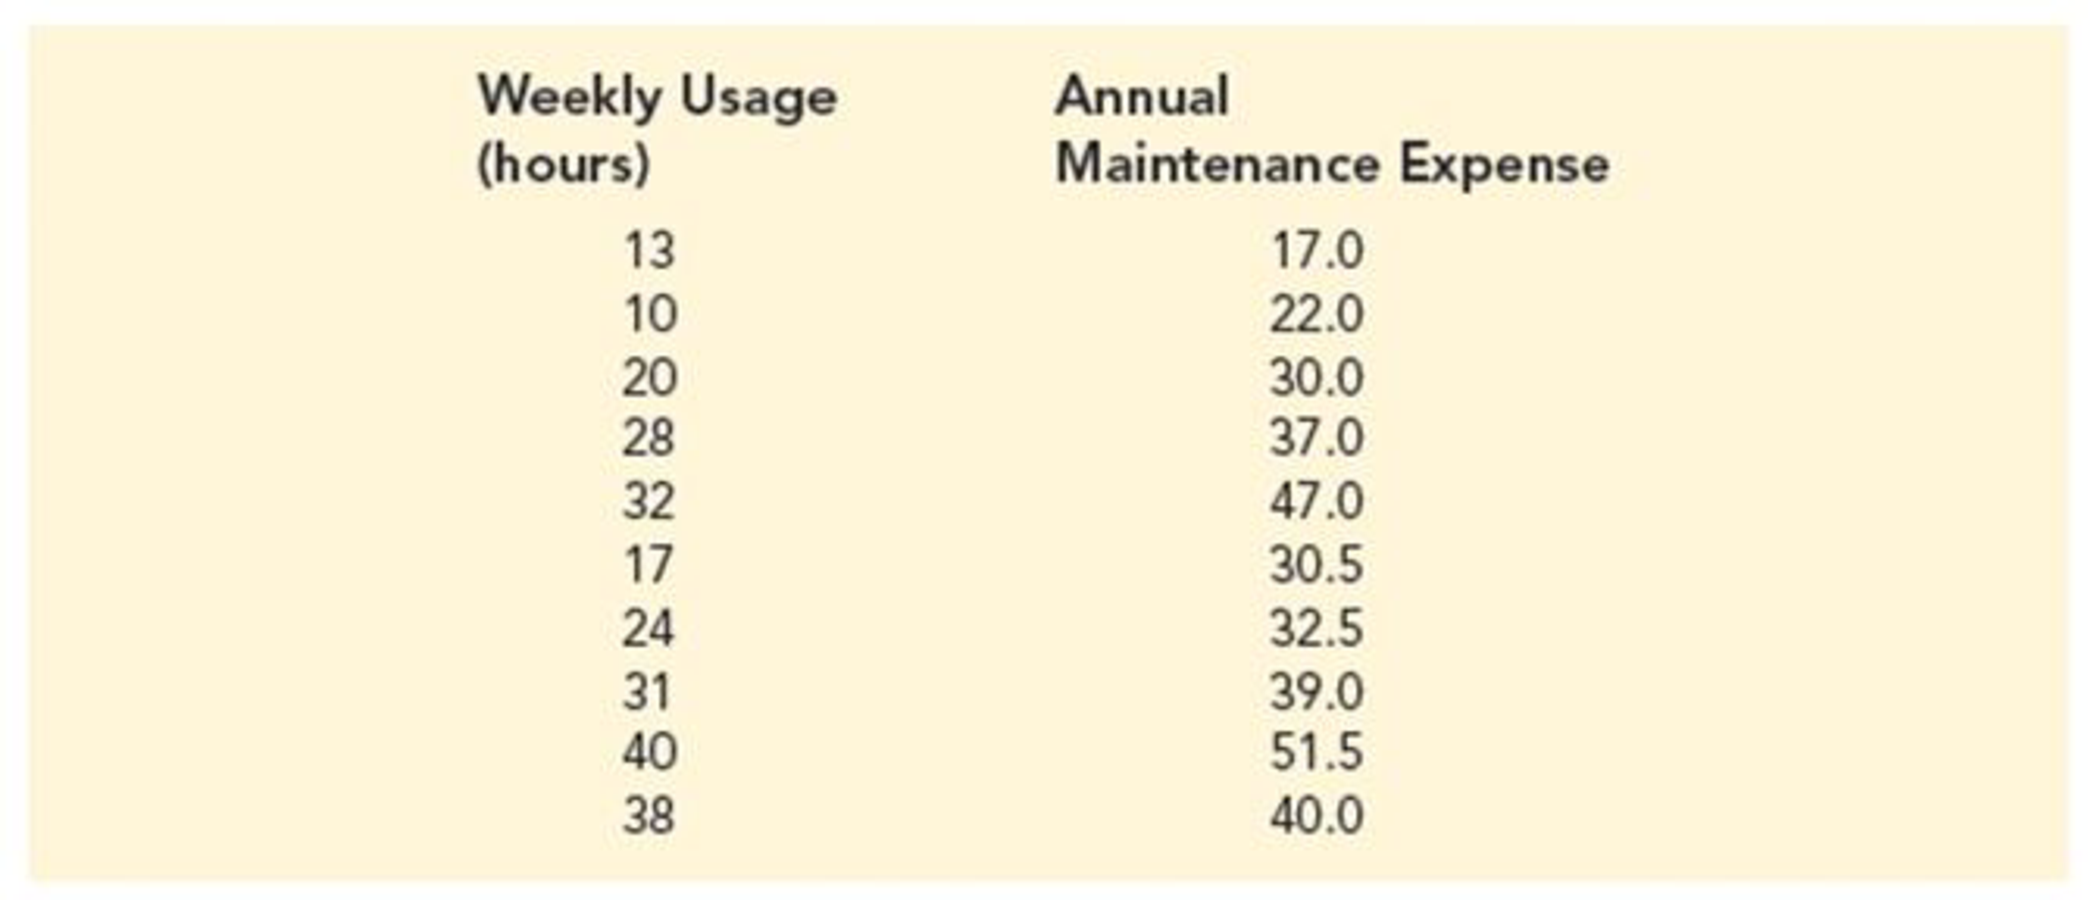
Machine Maintenance. Jensen Tire & Auto is in the process of deciding whether to purchase a maintenance contract for its new computer wheel alignment and balancing machine. Managers feel that maintenance expense should be related to usage, and they collected the following information on weekly usage (hours) and annual maintenance expense (in hundreds of dollars).
- a. Develop the estimated regression equation that relates annual maintenance expense to weekly usage.
- b. Test the significance of the relationship in part (a) at a .05 level of significance.
- c. Jensen expects to use the new machine 30 hours per week. Develop a 95% prediction interval for the company’s annual maintenance expense.
- d. If the maintenance contract costs $3000 per year, would you recommend purchasing it? Why or why not?
a.
Find the estimated regression equation that relates annual maintenance expense to weekly usage.
Answer to Problem 58SE
The estimated regression equation is
Explanation of Solution
Calculation:
The data related to the weekly usage (hours) and Annual Maintenance Expense (in hundreds of dollars) to purchase a maintenance contract for new computer wheel alignment and balancing machine.
Regression:
Software procedure:
Step-by-step procedure to obtain the estimated regression equation using Excel:
- In Excel sheet, enter Size and Selling Price in different columns.
- In Data, select Data Analysis and choose Regression.
- In Input Y Range, select Expense.
- In Input X Range, select Usage.
- Select Labels.
- Click OK.
Output obtained using Excel is given below:
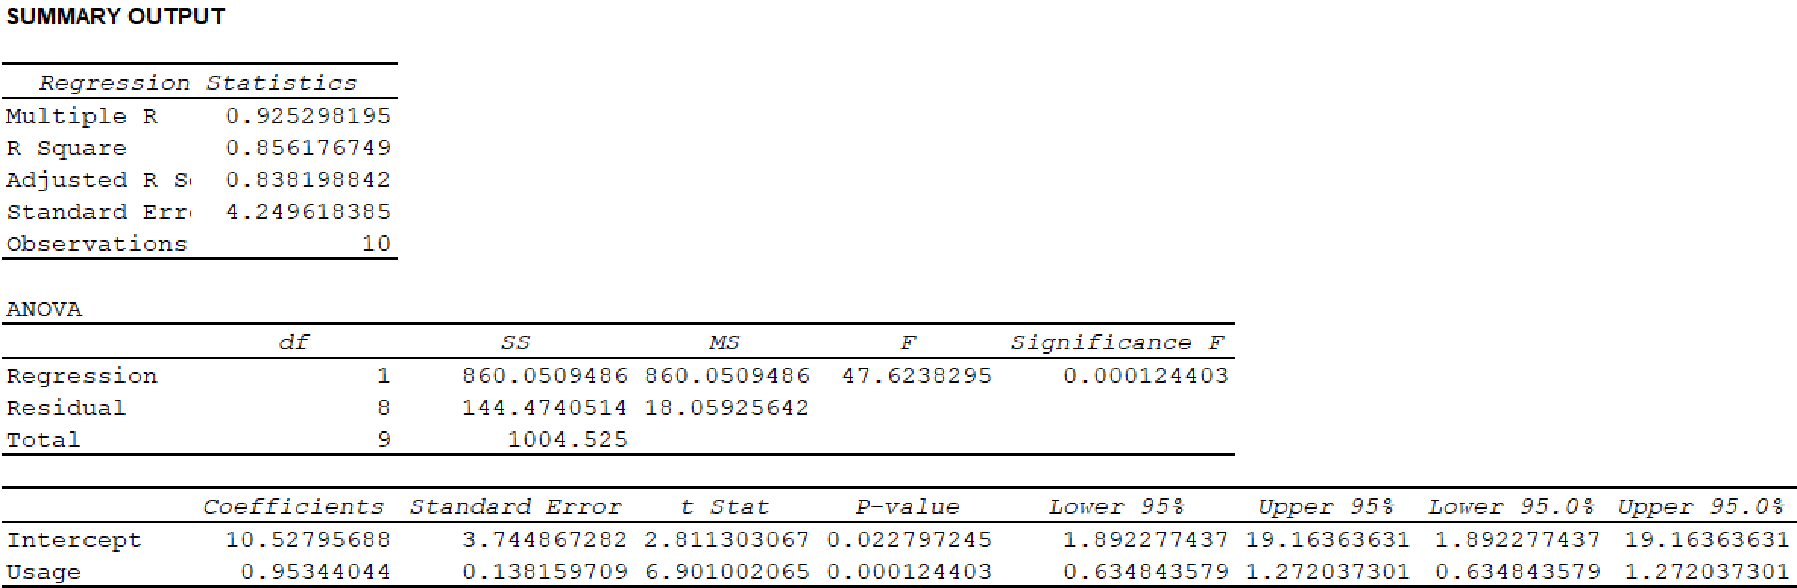
Thus, the estimated regression equation is
b.
Test for a significant relationship at
Answer to Problem 58SE
There is a significant relationship between annual maintenance expense and weekly usage.
Explanation of Solution
Calculation:
State the test hypotheses.
Null hypothesis:
That is, there is no significant relationship between expense and usage.
Alternative hypothesis:
That is, there is a significant relationship between expense and usage.
From the output in Part (a) it is found that the F-test statistic is 47.62.
Level of significance:
The given level of significance is
p-value:
From the output in pat (a) it is found that the p-value is 0.00.
Rejection rule:
If the
Conclusion:
Here, the p-value is less than the level of significance.
That is,
Thus, the decision is “reject the null hypothesis”.
Therefore, the data provide sufficient evidence to conclude that there is a significant relationship between expense and usage.
Thus, annual maintenance expense and weekly usage are related.
c.
Find a 95% prediction interval for the company’s annual maintenance expense.
Answer to Problem 58SE
The 95% prediction interval for the company’s annual maintenance expense is
Explanation of Solution
Calculation:
For a sample of size n, the degrees of freedom is given as
In this given problem, for sample of size 10, the degrees of freedom is as follows:
Thus, the degrees of freedom is 8.
Level of significance:
The given level of significance is
For two-tails distribution, the value is as follows:
Form the table 2 of “t Distribution” in Appendix B, it is found that the value of t test statistic with level of significance 0.025 and degrees of freedom 8 is
According to the regression equation
Thus, the possible value of dependent variable y when
The estimate of standard deviation corresponding to the prediction of the value of
It is known for a sample size n that mean of a random variable x can be obtained as follows:
Thus, mean of the random variable x is given below:
The value of
| 13 | 151.29 |
| 10 | 234.09 |
| 20 | 28.09 |
| 28 | 7.29 |
| 32 | 44.89 |
| 17 | 68.89 |
| 24 | 1.69 |
| 31 | 32.49 |
| 40 | 216.09 |
| 38 | 161.29 |
| Total | 946.1 |
Here, it is found that,
From the output, the value of given MSE for sample of size 10 is
The standard error of the estimate is obtained as follows:
Thus, the standard error of the estimate is 4.2496.
It is also found that for
For
Thus, the standard deviation of an individual value of y for
The prediction interval for expected value of
Therefore, the required prediction interval is given below:
Thus, the 95% prediction interval for the company’s annual maintenance expense is
d.
Explain whether it is recommended purchase a machine of the maintenance costs of $3,000 per year.
Explanation of Solution
Calculation:
The estimated regression equation is
Substitute 30 for usage in estimated regression equation.
In this case, the expected expense is 39.12 or $3,912. Therefore, it is recommended purchase a machine of the maintenance costs of $3,000 per year.
Want to see more full solutions like this?
Chapter 14 Solutions
Modern Business Statistics with Microsoft Office Excel (with XLSTAT Education Edition Printed Access Card) (MindTap Course List)


- Find the equation of the regression line for the following data set. x 1 2 3 y 0 3 4arrow_forwardLife Expectancy The following table shows the average life expectancy, in years, of a child born in the given year42 Life expectancy 2005 77.6 2007 78.1 2009 78.5 2011 78.7 2013 78.8 a. Find the equation of the regression line, and explain the meaning of its slope. b. Plot the data points and the regression line. c. Explain in practical terms the meaning of the slope of the regression line. d. Based on the trend of the regression line, what do you predict as the life expectancy of a child born in 2019? e. Based on the trend of the regression line, what do you predict as the life expectancy of a child born in 1580?2300arrow_forwardDemand for Candy Bars In this problem you will determine a linear demand equation that describes the demand for candy bars in your class. Survey your classmates to determine what price they would be willing to pay for a candy bar. Your survey form might look like the sample to the left. a Make a table of the number of respondents who answered yes at each price level. b Make a scatter plot of your data. c Find and graph the regression line y=mp+b, which gives the number of respondents y who would buy a candy bar if the price were p cents. This is the demand equation. Why is the slope m negative? d What is the p-intercept of the demand equation? What does this intercept tell you about pricing candy bars? Would you buy a candy bar from the vending machine in the hallway if the price is as indicated. Price Yes or No 50 75 1.00 1.25 1.50 1.75 2.00arrow_forward
 Algebra and Trigonometry (MindTap Course List)AlgebraISBN:9781305071742Author:James Stewart, Lothar Redlin, Saleem WatsonPublisher:Cengage Learning
 Functions and Change: A Modeling Approach to Coll...AlgebraISBN:9781337111348Author:Bruce Crauder, Benny Evans, Alan NoellPublisher:Cengage Learning
 Calculus For The Life SciencesCalculusISBN:9780321964038Author:GREENWELL, Raymond N., RITCHEY, Nathan P., Lial, Margaret L.Publisher:Pearson Addison Wesley,
 Glencoe Algebra 1, Student Edition, 9780079039897...AlgebraISBN:9780079039897Author:CarterPublisher:McGraw Hill
