
(a)
Interpretation:
The chemistry of the analytical method should be explained.
Concept introduction:
Quenching is the process of nonradiative energy transfer from an excited species to another molecule. This requires a contact between the excited species and a quenching agent. The rate of quenching is higher when the quencher concentration is high, because of higher number of collisions during the lifetime of the excited state.
Answer to Problem 15.16QAP
Al-acid alizarin garnet R acts as a quencher. The decrease in fluorescence is due to absorbing emission energy from F- by Al-acid alizarin garnet R complex.
Explanation of Solution
In this experiment standard addition technique has been used. Four water samples with same volume are taken and they have been spiked with standard F-. Different volumes of standard F- solution are added to the water samples prepared. Then excess, but same volumes of Al-acid alizarin garnet R are added to the four solutions. This Al-acid alizarin garnet R acts as a quencher. The complex absorbs emission energy from F-. So, instead of producing fluorescence from emission energy, it is quenched by the complex. So, the fluorescence intensity decreases.
(b)
Interpretation:
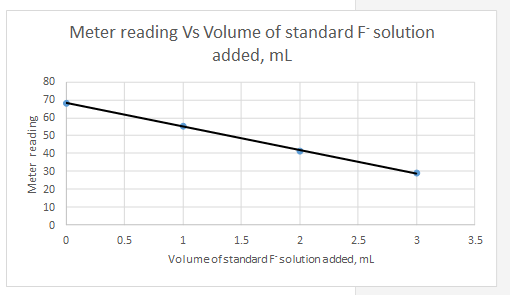
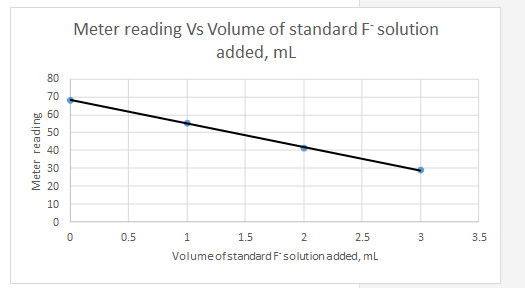
A plot of data should be constructed.
Concept introduction:
Standard addition method is used to analyze complex samples which matrix effect is significant. One common approach is standard addition technique is spiking of sample. In this method, one or more increments of a standard solution is added to the several aliquots of sample containing same volume. Each solution is then diluted to a fixed volume and experiment is proceeded.
Answer to Problem 15.16QAP
Explanation of Solution
Meter reading is the dependent variable and the volume of standard added is the independent variable.
(c)
Interpretation:
A relationship for multiple standard additions should be derived. An equation for the unknown concentration should be obtained in terms of the slope and the intercept of the standard addition plot.
Concept introduction:
Several aliquots with volume Vx of an unknown solution which have a concentration Cx are measured into volumetric flasks with volume Vt and then a standard solution with concentration Csis added in variable volumes of Vs. Then other reagents that aid for the detection are added and each volumetric flask is topped up to the maximum volume. Then instrumental measurements are made on each solution. If the instrumental response is proportional to the concentration of analyte, following equation can be derived.
k is a proportionality constant. According to above equation the instrumental signal versus Vs is a plot in the form of
Concentration of unknown then can be obtained by following equation.
Answer to Problem 15.16QAP
Explanation of Solution
The fluorescence decreases with the increasing amounts of F- standard. The control sample has the highest fluorescence meter reading. So the equation 1 can be rewrite as
The meter reading versus the volume of standard added has a linear relationship. Above equation can be written in the form of
An equation for the concentration of unknown can be derived by taking the ratio of intercept and the slope of fluorescence Vs Vs graph.
(d)
Interpretation:
The equation for the line representing the decrease in fluorescence relative to volume of standard should be determined.
Concept introduction:
In the least squares method, in order to find the slope and the intercept the three quantities Syy, Sxx and Sxy should be determined.
The slope of the line,
The intercept,
Answer to Problem 15.16QAP
Explanation of Solution
The three quantities Syy, Sxx and Sxy can be easily calculated using a spreadsheet and then the slope and the intercept can be calculated using the given equations.
| Vs, mL | Meter reading | |||||
| 0 | 68.2 | -1.5 | 19.8 | 392.04 | 2.25 | -29.7 |
| 1 | 55.3 | -0.5 | 6.9 | 47.61 | 0.25 | -3.45 |
| 2 | 41.3 | 0.5 | -7.1 | 50.41 | 0.25 | -3.55 |
| 3 | 28.8 | 1.5 | -19.6 | 384.16 | 2.25 | -29.4 |
| Sum | 874.22 | 5 | -66.1 | |||
| 48.4 | ||||||
| 1.5 |
So the equation for the line for the standard addition plot is
(e)
Interpretation:
The standard deviation of the slope and the intercept should be determined.
Concept introduction:
Standard deviation about regression,
N − number of points used.
The standard deviation of the slope,
The standard deviation of the intercept,
Answer to Problem 15.16QAP
Standard deviation of the slope = 0.194
Standard deviation of the intercept = 0.837
Explanation of Solution
in order to calculate the standard deviation of the slope or intercept, first standard deviation about regression should be determined.
Standard deviation of the slope,
Standard deviation of the intercept,
(f)
Interpretation:
The concentration of F- in the sample in parts per billion should be determine.
Concept introduction:
Cx − concentration of the unknown solution
Cs − concentration of standard solution
Vx − volume of unknown solution
m − slope of the instrumental signal versus volume of standard added curve
b − intercept of the instrumental signal versus volume of standard added curve
Answer to Problem 15.16QAP
Explanation of Solution
Intercept = 68.23
Slope = -13.22
Concentration of standard = 10.0 ppb
Volume of unknown = 10.00 mL
(g)
Interpretation:
The standard deviation of the result in (f) should be determined
Concept introduction:
Sv − standard deviation in volume
Sy − standard deviation in signal
m −slope
N − number of points
Sc − standard deviation in concentration
Answer to Problem 15.16QAP
Explanation of Solution
Want to see more full solutions like this?
Chapter 15 Solutions
Principles of Instrumental Analysis

- Quinine in a 1.553-g antimalarial tablet was dissolved in sufficient 0.10 M HCl to give 250 mL of solution.A 10.00-mL aliquot was then diluted to 50.00 mL with the acid. The fluorescence intensity for the dilutedsample at 347.5 nm provided a reading of 196 on an arbitrary scale. A standard 100-ppm quinine solutionregistered 125 when measured under conditions identical to those for the diluted sample. Calculate the massin milligrams of quinine in the tablet.arrow_forwardMercury(II) forms a 1:1 complex with triphenyltetrazolium chloride that exhibits an absorption maximum at 255 nm. The mercury(II) in a soil sample was extracted into an organic solvent containing an excess of TTC , and the resulting solution was diluted to 100.0 mL in a volumetric flask. Five-milliliter aliquots of the analyte solution were then transferred to six 25-mL volumetric flasks. A standard solution was then prepared that was 5*10^-6 M in . Volumes of the standard solution shown in the table were then pipetted into the volumetric flasks, and each solution was then diluted to 25.00 mL. The absorbance of each solution was measured at 255 nm in 1.00-cm quartz cells. Please solve and explain these questions: A.) Enter the given data pictured above into a spreadsheet and show the correct standard additions plot B.) Determine the slope and the intercept of the line C.)Determine the standard deviation of the slope and the intercept. D.) Calculate the concentration of Hg(II) in the…arrow_forwardA student obtained a sample impure ASA sample. He hydrolyzed the ASA with NaOH and heated the mixture to produce the salicylate dianion: C6H4 (OCOCH3) (COOH) + 3OH- → C6H4 (0) (COO) + 2 H₂O + CH3COO Next the student then acidified the mixture with FeCl3-KCI-HCI solution to produce the magenta complex of tetraaquosalicylatoiron (III) ion: C6H4 (0) (COO) + H3O+ C6H4 (OH) (COO-) + H₂O 3+ C6H4 (OH) (COO) + Fe(H₂O) ³+ [C6H4 (O) (COO) Fe(H₂O)] ++ H₂O + H₂O*arrow_forward
- A student obtained a sample impure ASA sample. He hydrolyzed the ASA with NaOH and heated the mixture to produce the salicylate dianion: C6H4 (OCOCH3) (COOH) + 3OH- → C6H4 (0) (COO) + 2 H₂O + CH3COO Next the student then acidified the mixture with FeCl3-KCI-HCI solution to produce the magenta complex of tetraaquosalicylatoiron (III) ion: C6H4 (0) (COO) + H3O+ C6H4 (OH) (COO-) + H₂O 3+ C6H4 (OH) (COO) + Fe(H₂O) ³+ [C6H4 (O) (COO) Fe(H₂O)] ++ H₂O + H₂O*arrow_forwardAbsorbance at 453 nm 8393939 7 fl. oz./20 ml Beer-Lambert's Law (Spectrophotometry) #1 Fe (aq) + KSCN(s) FESCN "(aq) + K" (aq) 3+ To determine the moles of Fe (aq) in a 100. mL sample of an unknown solution, excess KSCN(s) is added to convert all the Fe (aq) into the dark red species FeSCN"(aq), as represented by the equation above. The absorbance of FESCN"(aq) at different concentrations is shown in the graph below. 2+ 0.50 目0.40 0.30 0.20 01 0. 0. 5 x 10⁻⁵ 10 x 10-5 Concentration of FESCN2+ (M) If the absorbance of the mixture is 0.20 at 453 nm, haw many moles of Fe (aq) were present in the 100. mL sample? (Assume that any volume change due to adding the KSCN(s) Iis negligible.) 3+, 4x10⁻⁴ mol 3 x 10⁴ mol (B) 4x 10⁻⁶ mol 3x 10⁻⁶ molarrow_forwardExactly 5.00 mL aliquots of a solution containing analyte X were transferred into 50.00-mL volumetric flasks and the pH of the solution is adjusted to 9.0. The following volumes of a standard solution containing 2.00 µg/mL of X were then added into each flask and the mixture was diluted to volume: 0.000, 0.500, 1.00, 1.50 and 2.00 mL. The fluorescence of each of these solutions was measured with a fluorometer, and the following values were obtained: 3.26, 4.80, 6.42, 8.02 and 9.56, respectively. ii. Using relevant functions in Excel, derive a least-squares equation for the data, and use the parameters of this equation to find the concentration of the phenobarbital in the unknown solution.arrow_forward
- The absorbance of 1.48x 10⁵ M methyl red solution, prepared in 0.1 M HCI, was measured using a 1.0 cm cell (cuvette) and found to be 0.550 at 524 nm. Calculate the molar absorption of methyl red under these conditions. Select one: 42956 M¹ cm-¹ < 18524 M²¹ cm 1 O37162 M.¹ cm ¹ 12760 M¹¹cm¹arrow_forwardYou have a specimen composed of germanium and iron, distributed uniformly. The XRF spectrum shows two Kα Kβ doublets, characteristic for the two elements. The intensity (i.e., line amplitude) of Kα Fe is equal to the intensity of the Kα Ge. Can you conclude that there are equal contents of Fe and Ge in your specimen? Explain.arrow_forwardThe complex formed between Cu(I) and 1,10-phenanthroline has a molar absorptivity of 7000 L mol-1 cm-1 at 435 nm, the wavelength of the maximum absorption. Calculate (a) the absorbance of 8.50 X 10⁻⁵ solution of the complex when measured in a 1.00-cm cell at 435 nm. (b) the percent transmittance of the solution in a part (a) (c) the concentration of a solution that in a 5.00-cm cell has the same absorbance as the solution in part (a) (d) the pathlength through a 3.40 X 10⁻⁵ M solution of the complex that is needed for an absorbance that is the same as the solution in part (a)arrow_forward
- A student mixed 5.00mL of 0.0020M Fe(NO3)3, 3.00mL of 0.0020M KSCN, and 3.00mL of distilled water. The mixture reacted to form a reddish solution indicating that FeSCN2+ was formed, according to the equation below. An absorbance of 0.21 was measured for this solution in a Spectrophotometer set at a wavelength of 447nm. Fe³+ (aq) + SCN (aq) FeSCN2+ (aq) A calibration curve was used to find the equilibrium concentration of the product of this reaction: y = 1895x + 0.027 Calculate the equilibrium concentration of the Fe³+ Report your answer to 4 sig figsarrow_forwardThe levels of Vitamin B1 in a sample of milk was determined using the Standard Addition method and technique of fluorescence spectroscopy. 18.0 ml of the milk sample was diluted to 20.0 ml using distilled water and then the fluorescence was measured. The resulting signal was 210 units. A spike was made by taking 18.0 ml of the same milk sample, adding 1.0 ml of a 6.0 ppm Vitamin B1 standard solution, and then diluting to 20.0 ml using distilled water. The signal of the spiked milk was 540 units. Calculate the concentration of Vitamin B1 in the original milk sample (in ppm). Report to 3 decimal places.arrow_forwardA standard solution was put through appropriate dilutions to give the concentrations of iron shown in the table that follows. The iron(II)-1,10-phenanthroline complex was then formed in 25.0-mL aliquots of these solutions, following which each was diluted to 50.0 mL. The following absorbances (1.00-cm cells) were recorded at 510 nm: Calculate the concentration, in ppm, of a sample with an abosrbance of 0.829. Fe(II) concentration (ppm) A510 4.00 0.160 10.0 0.390 16.0 0.630 24.0 0.950 32.0 1.260 40.0 1.580arrow_forward
 Principles of Instrumental AnalysisChemistryISBN:9781305577213Author:Douglas A. Skoog, F. James Holler, Stanley R. CrouchPublisher:Cengage Learning
 Principles of Modern ChemistryChemistryISBN:9781305079113Author:David W. Oxtoby, H. Pat Gillis, Laurie J. ButlerPublisher:Cengage Learning
 Macroscale and Microscale Organic ExperimentsChemistryISBN:9781305577190Author:Kenneth L. Williamson, Katherine M. MastersPublisher:Brooks Cole