Horngren's Financial & Managerial Accounting, The Financial Chapters (Book & Access Card)
5th Edition
ISBN: 9780134078939
Author: Tracie L. Miller-Nobles, Brenda L. Mattison, Ella Mae Matsumura
Publisher: PEARSON
expand_more
expand_more
format_list_bulleted
Videos
Textbook Question
Chapter 15, Problem 15.22E
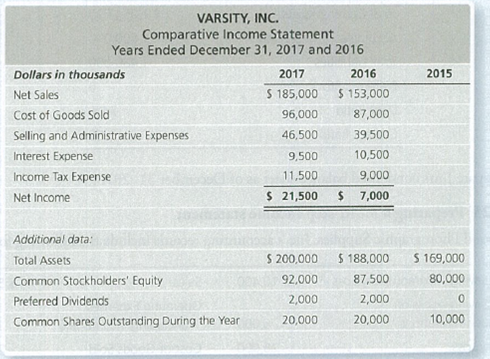
Analyzing profitability
Varsity, Inc.’s comparative income statement follows. The 2015 data are given as needed.
Requirements
- 1. Calculate the profit margin ratio for 2017 and 2016.
- 2. Calculate the
rate of return on total assets for 2017 and 2016. - 3. Calculate the asset turnover ratio for 2017 and 2016.
- 4. Calculate the rate of return on common
stockholders' equity for 2017 and 2016. - 5. Calculate the earnings per share for 2017 and 2016.
- 6. Calculate the 2017 dividend payout on commons tock. Assume dividends per share for common stock are equal to $ 0.75 per share.
- 7. Did the company's operating performance improve or deteriorate during 20 17?
Expert Solution & Answer
Want to see the full answer?
Check out a sample textbook solution
Students have asked these similar questions
A company’s comparative statements are given below. Please conduct the following analyses:
c. Calculate the three profitability ratios for year 2017 and show how ROE can be derived from the DuPont formula for this company.
d. What do the analyses tell you about the company’s financial performance?
Compute the following for year 20171. Gross Margin Ratio2. Operating Profit Margin3. Net Profit Margin or Return on Sales4. Return on Equity5. Return on Assets
I need assistance on the following regarding the attached balance sheet and income statement:
Required:
a) Calculate the following financial ratios for 2016 and 2017
16. Earnings per share
17. Price-earnings ratio (Use year-end adjusted closing stock price of $57.32 for 2017 and $63.69 for 2016)
18. Dividend yield
19. Dividend payout ratio
Chapter 15 Solutions
Horngren's Financial & Managerial Accounting, The Financial Chapters (Book & Access Card)
Ch. 15 - What part of the Libertys annual report is written...Ch. 15 - Horizontal analysis of Liberty's balance sheet for...Ch. 15 - Vertical analysis of Liberty's balance sheet for...Ch. 15 - Which statement best describes Liberty's acid-test...Ch. 15 - Liberty's inventory turnover during 2017 was...Ch. 15 - Prob. 6QCCh. 15 - Prob. 7QCCh. 15 - Liberty's rate of return on common stockholders'...Ch. 15 - The company has 2,500 shares of common stock...Ch. 15 - Prob. 10AQC
Ch. 15 - What ate the three main ways to analyze financial...Ch. 15 - What is an annual report? Briefly describe the key...Ch. 15 - Prob. 3RQCh. 15 - What is trend analysis, and how does it differ...Ch. 15 - Prob. 5RQCh. 15 - Prob. 6RQCh. 15 - Prob. 7RQCh. 15 - Briefly describe the ratios that can be used to...Ch. 15 - Prob. 9RQCh. 15 - Briefly describe the ratios that can be used to...Ch. 15 - Briefly describe the ratios that can be used to...Ch. 15 - Prob. 12RQCh. 15 - Prob. 13RQCh. 15 - Prob. 14RQCh. 15 - Prob. 15RQCh. 15 - Prob. 15.1SECh. 15 - Performing horizontal analysis McDonald Corp....Ch. 15 - Calculating trend analysis Variline Corp. reported...Ch. 15 - Performing vertical analysis Hoosier Optical...Ch. 15 - Preparing common-size income statement Data for...Ch. 15 - Shine's Companies, a home improvement store chain,...Ch. 15 - Shine's Companies, a home improvement store chain,...Ch. 15 - Shine's Companies, a home improvement store chain,...Ch. 15 - Prob. 15.9SECh. 15 - Prob. 15.10SECh. 15 - Prob. 15.11SECh. 15 - Using ratios to reconstruct a balance sheet...Ch. 15 - Prob. 15.13SECh. 15 - Prob. 15.14SECh. 15 - Prob. 15.15ECh. 15 - Computing trend analysis Grand Oaks Realty's net...Ch. 15 - Prob. 15.17ECh. 15 - Prob. 15.18ECh. 15 - Prob. 15.19ECh. 15 - Prob. 15.20ECh. 15 - Analyzing the ability to pay liabilities Big Bend...Ch. 15 - Analyzing profitability Varsity, Inc.s comparative...Ch. 15 - Prob. 15.23ECh. 15 - Using ratios to reconstruct a balance sheet The...Ch. 15 - Prob. 15.25ECh. 15 - Computing earnings per share Falconi Academy...Ch. 15 - Prob. 15.27APCh. 15 - Prob. 15.28APCh. 15 - Prob. 15.29APCh. 15 - Prob. 15.30APCh. 15 - Using ratios to evaluate a stock investment...Ch. 15 - Prob. 15.32APCh. 15 - Preparing an income statement The following...Ch. 15 - Computing trend analysis and return on common...Ch. 15 - Prob. 15.35BPCh. 15 - Prob. 15.36BPCh. 15 - Determining the effects of business transactions...Ch. 15 - Prob. 15.38BPCh. 15 - Prob. 15.39BPCh. 15 - Prob. 15.40BPCh. 15 - Prob. 15.41CPCh. 15 - Lance Berkman is the controller of Saturn, a dance...Ch. 15 - Prob. 15.1CTEI
Knowledge Booster


Learn more about
Need a deep-dive on the concept behind this application? Look no further. Learn more about this topic, accounting and related others by exploring similar questions and additional content below.Similar questions
- Financial statement data for years ending December 31 for Latchkey Company follows: a. Determine the ratio of sales to assets for 2016 and 2015. b. Does the change in the ratio of sales to assets from 2015 to 2016 indicate a favorable or an unfavorable trend?arrow_forwardUsing the financial statements in the image, calculate the following ratios for both the FY 2017 and FY 2018: Current Ratio Quick Ratio Total Asset Turnover Average Collection Total Debt to Total Assets Times Interest Earned Net Profit Margin Return on Assets Return on Equity Modified Du Point Equation for FY 2018 PE Ratio Market to Book Ratioarrow_forwardUsing the fiscal year end 2019 annual report for General Mills, Inc. and the figures from the 2017 annual report as noted below, calculate the financial ratios for 2019 and 2018 indicated using the EXCEL template provided: Gross profit percentage Return on sales Asset turnover Return on assets Return on common stockholders’ equity Current ratio Quick ratio Operating-cash-flow-to-current-liabilities ratio 9. Accounts receivable turnover Total assets 2017 = $21,812.6 Total stockholders’ equity 2017 = $4,327.9 Total current liabilities 2017 = $5,330.8 Accounts receivable 2017 = $1,430.1 Inventory 2017 = $1,483.6 Year-end closing stock price May 2019 = $50.93 Year-end closing stock price May 2018 = $39.37arrow_forward
- Select 2017 Year From The Given Data In Image And Find The Following thing:1) Balance Sheet Growth - (TOTAL ASSETS CURRENT YEAR- TOTAL ASSETS CURRENT YEAR) / TOTAL ASSETS PREVIOUS YEAR.2) Sales.3) Financial Exp as a % of Sales4) EBIT5) Financial Cost / Interest Expensearrow_forwardUsing the fiscal year end 2020 annual report for General Mills, Inc. and the figures from the 2020 annual report as noted below, calculate the financial ratios for 2020 and 2019 indicated using the EXCEL template provided:1. Gross profit percentage2. Return on sales3. Asset turnover 4. Return on assets5. Return on common stockholders’ equity6. Current ratio7. Quick ratio8. Operating-cash-flow-to-current-liabilities ratio9. Accounts receivable turnoverTotal assets 2020 = $30,806.7Total stockholders’ equity 2020 = $8,349.5Total current liabilities 2020 = $7,491.5Accounts receivable 2020 = $1,615.1Inventory 2020 = $1,426.3Year-end closing stock price May 2020 = $58.80Year-end closing stock price May 2019 = $53.56 To calculate averages use (current year balance + poor year balance) / 2) Round percentages to 1 decimal place; round other answers to 2 decimal places.arrow_forwardCompute for Profitability Ratio in 2015 and 2016: 1. Gross Margin Ratio 2. Profit Margin Ratio 3. Return on Asset Ratioarrow_forward
- Instructions Using the financial statements and additional information, compute the following ratios for the El Camino Company for 2021. Show all computations. Computations 1. Current ratio 2. Return on common stockholders' equity 3. Price-earnings ratio 4. Inventory turnover 5. Accounts receivable turnover 6. Times interest earned 7. Profit margin 8. Days in inventory 9. Payout ratio 10. Return on assetsarrow_forwardcalculate the table below based on the income statement and balance sheet attached Ratio Anaylsis 2021 est 2020 2019 Industry Average Profitability Ratios Profit Margin on Sales (%) 8 Earning Power (%) 17.2 Return on Total Assets (%) 12 Return on Common Equity (%) 25 Market Value Ratios Price/Earnings Ratio Price/Earnings Ratio (times) 12.5 Price/Cash Flow Ratio (times) 6.8 Market /Book Value Ratio (times) 1.7arrow_forwardGiven the income statement for the MLC (Table 4–7) and balance sheet(Table 4–4), answer the following:a. Calculate the following ratios for 2012: operating profit margin, net profitmargin, operating return on assets, net return on assets, and return onequity.b. In a written explanation, describe what each ratio means.c. In a brief paragraph, describe the overall profitability of the MLC.arrow_forward
arrow_back_ios
arrow_forward_ios
Recommended textbooks for you

 Financial AccountingAccountingISBN:9781305088436Author:Carl Warren, Jim Reeve, Jonathan DuchacPublisher:Cengage Learning
 Financial Accounting: The Impact on Decision Make...AccountingISBN:9781305654174Author:Gary A. Porter, Curtis L. NortonPublisher:Cengage Learning
 Cornerstones of Financial AccountingAccountingISBN:9781337690881Author:Jay Rich, Jeff JonesPublisher:Cengage Learning
 Intermediate Financial Management (MindTap Course...FinanceISBN:9781337395083Author:Eugene F. Brigham, Phillip R. DavesPublisher:Cengage Learning
Financial Accounting
Accounting
ISBN:9781305088436
Author:Carl Warren, Jim Reeve, Jonathan Duchac
Publisher:Cengage Learning
Financial Accounting: The Impact on Decision Make...
Accounting
ISBN:9781305654174
Author:Gary A. Porter, Curtis L. Norton
Publisher:Cengage Learning
Cornerstones of Financial Accounting
Accounting
ISBN:9781337690881
Author:Jay Rich, Jeff Jones
Publisher:Cengage Learning
Intermediate Financial Management (MindTap Course...
Finance
ISBN:9781337395083
Author:Eugene F. Brigham, Phillip R. Daves
Publisher:Cengage Learning
Financial ratio analysis; Author: The Finance Storyteller;https://www.youtube.com/watch?v=MTq7HuvoGck;License: Standard Youtube License