
Essentials of Business Analytics (MindTap Course List)
2nd Edition
ISBN: 9781305627734
Author: Jeffrey D. Camm, James J. Cochran, Michael J. Fry, Jeffrey W. Ohlmann, David R. Anderson
Publisher: Cengage Learning
expand_more
expand_more
format_list_bulleted
Videos
Textbook Question
Chapter 15, Problem 22P
Three decision makers have assessed utilities for the following decision problem (payoff in dollars):
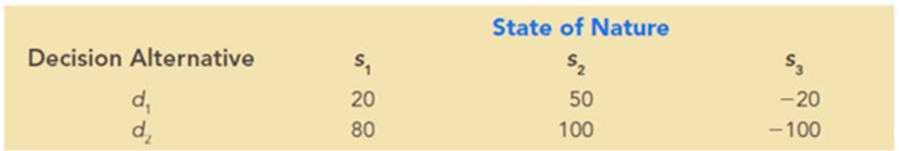
The indifference
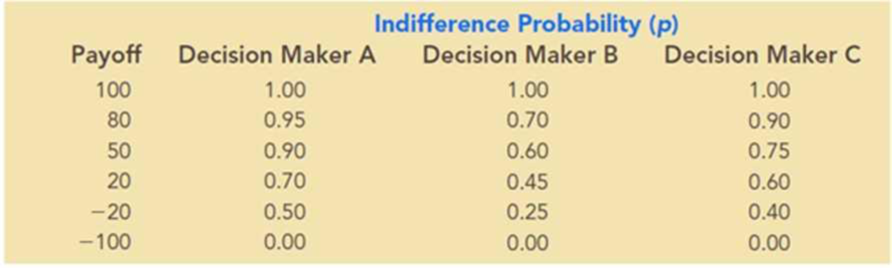
- a. Plot the utility
function for money for each decision maker. - b. Classify each decision maker as a risk avoider, a risk taker, or risk-neutral.
- c. For the payoff of 20, what is the premium that the risk avoider will pay to avoid risk? What is the premium that the risk taker will pay to have the opportunity of the high payoff?
Expert Solution & Answer
Want to see the full answer?
Check out a sample textbook solution
Students have asked these similar questions
The distribution of the variable Local Tuition is skewed to the:
Select one:
a.
Right
b.
Left
Business School
Full-Time Enrollment
Students per Faculty
Local Tuition ($)
Foreign Tuitiion ($)
English Test
Work Experience
Starting Salary ($)
1
Melbourne Business School
200
5
24,420
29,600
No
Yes
71,400
2
University of New South Wales (Sydney)
228
4
19,993
32,582
No
Yes
65,200
3
Indian Institute of Management (Ahmedabad)
392
5
4,300
4,300
No
No
7,100
4
Chinese University of Hong Kong
90
5
11,140
11,140
No
No
31,000
5
International University of Japan (Niigata)
126
4
33,060
33,060
Yes
No
87,000
6
Asian Institute of Management (Manila)
389
5
7,562
9,000
No
Yes
22,800
7
Indian Institute of Management (Bangalore)
380
5
3,935
16,000
No
No
7,500
8
National University of Singapore
147
6
6,146
7,170
Yes
Yes
43,300
9
Indian Institute of Management (Calcutta)
463
8
2,880
16,000
No
No
7,400
10
Australian National University (Canberra)
42
2
20,300
20,300
Yes…
The amount of income spent on housing is an important component of the cost of living. The total costs of housing for homeowners might include mortgage payments, property taxes, and utility costs (water, heat, electricity). An economist selected a sample of 20 homeowners in New England and then calculated these total housing costs as a percent of monthly income, 5 years ago and now. The information is reported below. Is it reasonable to conclude the percent is less now than 5 years ago?
Homeowner
Five Years Ago
Now
Homeowner
Five Years Ago
Now
1
17
%
10
%
11
35
%
32
%
2
20
39
12
16
32
3
29
37
13
23
21
4
43
27
14
33
12
5
36
12
15
44
40
6
43
41
16
44
42
7
45
24
17
28
22
8
19
26
18
29
19
9
49
28
19
39
35
10
49…
Mr. William Profit is studying companies going public for the first time. He is particularly interested in the relationship between the size of the offering and the price per share. A sample of 15 companies that recently went public revealed the following information.
Size
Price
Size
Price
($ millions),
per Share,
($ millions),
per Share,
Company
x
y
Company
x
y
1
9.0
10.8
9
160.7
11.3
2
94.4
11.3
10
96.5
10.6
3
27.3
11.2
11
83.0
10.5
4
179.2
11.1
12
23.5
10.3
5
71.9
11.1
13
58.7
10.7
6
97.9
11.2
14
93.8
11.0
7
93.5
11.0
15
34.4
10.8
8
70.0
10.7
Click here for the Excel Data File
a. Determine the regression equation. (Round your answers to 4 decimal places.)
b-1. State the decision rule for 0.05 significance level: H0: β ≤ 0; H1: β > 0. (Round your answer to 3 decimal places.)
b-2. Compute the value of the test statistic. (Round your…
Chapter 15 Solutions
Essentials of Business Analytics (MindTap Course List)
Ch. 15 - Prob. 1PCh. 15 - Southland Corporation’s decision to produce a new...Ch. 15 - Amy Lloyd is interested in leasing a new Honda and...Ch. 15 - Investment advisors estimated the stock market...Ch. 15 - Hudson Corporation is considering three options...Ch. 15 - Prob. 6PCh. 15 - Myrtle Air Express decided to offer direct service...Ch. 15 - Video Tech is considering marketing one of two new...Ch. 15 - Seneca Hill Winery recently purchased land for the...Ch. 15 - Hemmingway, Inc. is considering a $5 million...
Ch. 15 - The following profit payoff table was presented in...Ch. 15 - Suppose that you are given a decision situation...Ch. 15 - A firm has three investment alternatives. Payoffs...Ch. 15 - Alexander Industries is considering purchasing an...Ch. 15 - In a certain state lottery, a lottery ticket costs...Ch. 15 - Three decision makers have assessed utilities for...Ch. 15 - In Problem 22, if P(s1) = 0.25, P(s2) = 0.50, and...Ch. 15 - Translate the following monetary payoffs into...Ch. 15 - Consider a decision maker who is comfortable with...
Knowledge Booster


Learn more about
Need a deep-dive on the concept behind this application? Look no further. Learn more about this topic, statistics and related others by exploring similar questions and additional content below.Similar questions
- The box plots represent a comparison of the annual salaries of a group of public and private employees $20,000 Public e. $40,000 $60,000 $80,000 Private $100,000 Cathy, a private employee, has an annual salary that is twice the minimum salary of the group of private employees. Dale is the highest paid among the group of public employees. Which of the following statements is true? Select one: a. The information provided is not sufficient to determine which of the two salaries is higher. b. none of these c. Cathy and Dale have the same annual salary. d. Cathy's annual salary is higher than Dale's. Dale's annual salary is higher than Cathy's.arrow_forwardSuppose the table below gives the average tuition and fees at 2-year and 4-year state schools in a particular state. Values are adjusted to 2019 dollars. Academic Year 4-year state school 2-year state school 2005-06 $5,904 $2,661 2006-07 $6,066 $2,539 2007-08 $6,289 $2,604 2008-09 $7,222 $2,901 2009-10 $7,738 $3,065 2010-11 $8,035 $3,117 2011-12 $8,154 $3,108 2012-13 $8,497 $3,075 2013-14 $8,578 $3,025 2014-15 $9,390 $3,326 2015-16 $10,004 $3,504 2016-17 $10,474 $3,663 2017-18 $10,789 $3,830 2018-19 $10,874 $3,859 2019-20 $10,900 $3,907 Here is a graph of the information from the table. a. What is the absolute change in tuition and fees at this state's four-year institutions from 2005-06 to 2019-20? b. What is the relative change in tuition and fees at this state's four-year institutions from 2005-06 to 2019-20? Round to the nearest whole percentage…arrow_forwardAlice has accumulated $260,557 in savings and wishes to invest this money sensibly. The types of investments and their corresponding percentages, recommended by a financial advisor, are shown in the following circle graph. Recommended Categories of Investment: stocks 13.73% mutual funds 51% real estate 10% annuities10% bonds 15.27% Find the amount of money that Alice should invest in stocks, mutual funds, real estate, annuities, and bonds. Round your answer to the nearest hundredth, if necessary.arrow_forward
- Private colleges and universities rely on money contributed by individuals and corporations for their operating expenses. Much of this money is invested in a fund called an endowment, and the college spends only the interest earned by the fund. A recent survey of five private colleges in the United States revealed the following endowments (in millions of dollars): 188.9, 249.3, 124.7, 157.6, and 222.8. What value will be used as the point estimate for the standard deviation of endowment of all private colleges in the United States? Round your answer to nearest hundredth(2d.p.) if necessary.arrow_forwardE. On a survey, why might you want to measure income at the ratio rather than ordinal level? Why might you want to measure income at ordinal rather than ratio level? Consider the kinds of claims you might want to make from your data and how you might gather the most valid data. Give a concrete example why each might be preferred (ratio rather than ordinal, ordinal rather than ratio), and make sure it is evident from your answer that you fully understand levels of measurement.arrow_forwardSome research situations are summarized below. For each situation, identify all variables.Then, for each variable, note the level of measurement AND whether it is an independent or dependent variable. a. A health researcher is interested in studying patient compliance (whether or not patients take the medicine their doctor prescribes). She surveys 800 diabetic patients, and finds compliance to be linked to patient age, education, gender, and socioeconomic status. b. A market researcher is hired by Target to see how customers buying habits have changed before and after COVID. The researcher studies how much each customer spent (in $s), how frequently they visited the website each month, how frequently they visited the store each month. They report that, since March, customers are spending less, visiting the website more frequently, and shopping in person less frequently.arrow_forward
- Some research situations are summarized below. For each situation, identify all variables.Then, for each variable, note the level of measurement AND whether it is an independent or dependent variable. a. A health researcher is interested in studying patient compliance (whether or not patients take the medicine their doctor prescribes). She surveys 800 diabetic patients, and finds compliance to be linked to patient age, education, gender, and socioeconomic status. b. A market researcher is hired by Target to see how customers buying habits have changed before and after COVID. The researcher studies how much each customer spent (in $s), how frequently they visited the website each month, how frequently they visited the store each month. They report that, since March, customers are spending less, visiting the website more frequently, and shopping in person less frequently. c. Do students prefer in-person or online courses? DePaul surveys subset of 200 students, and finds differences…arrow_forwardGrade points are assigned such that an A receives 4 points, a B receives 3 points, a C receives 2 points, a D receives 1 point, and a F receives 0 points. Grades are weighted according to credit hours (units). If a student receives an A in a four-unit class, a D in a two-unit class, a B in a three-unit class and a C in a three-unit class, what is the student's grade point average? O A. 2.75 O B. 1.75 O C. 3.00 O D. 2.50 Click to select your answer. DELL XXX EVD disc RW DELLarrow_forwardThe controller of Crane Industries has collected the following monthly cost data for analyzing the behaviour of electricity costs. Total Total Electricity Costs Machine Hours January $ 2,200 260 February 2,940 390 March 3,530 500 April 4,520 685 May 3,150 490 June 4,990 700 July 4,020 645 August 3,800 570 September 5,080 675 October 4,380 615 November 3,360 390 December 6,150 720arrow_forward
- Bargain Rental Car offers rental cars in an off-airport location near a major tourist destination in California. Management would like to better understand the variable and fixed portions of its car washing costs. The company operates its own car wash facility in which each rental car that is returned is thoroughly cleaned before being released for rental to another customer. Management believes that the variable portion of its car washing costs relates to the number of rental returns. Accordingly, the following data have been compiled: Month Rental Returns Car Wash Costs January 2,400 $ 11,300 February 2,500 $ 13,300 March 2,800 $ 12,100 April 3,100 $ 14,700 May 3,700 $ 16,500 June 5,100 $ 23,900 July 5,600 $ 22,500 August 5,600 $ 22,900 September 4,700 $ 23,100 October 4,100 $ 22,000 November 2,200 $ 11,000 December 2,900 $ 15,300 2. Using least-squares regression, estimate the variable cost per rental return and the monthly fixed cost incurred to wash cars. (Round Fixed cost to the…arrow_forwardA.) use the data from the table to construct tables showing the relationship between fear of walking alone and sex, controlling for whether the individual rents or owns his or her dwelling. B.) does renting versus owning one's dwelling explain the difference in fear between women and men? (Use percentage differences to support your answer) C.) has introducing home ownership shown that the relationship between sex and fear is spurious or is home ownership an intervening variable? Explain.arrow_forwardConsider the distribution of the prices of 15-pound bags of 17 different brands of dog food. Complete parts (a) through (d) below. ..... a. How many peaks would you expect for the distribution? O A. There would probably be three peaks, one for the low priced items, one for the average priced items, and one for the high priced items. B. There would probably be no peaks. The prices of competing products tend to form a uniform distribution. C. There would probably be many peaks corresponding to the different brands. O D. There would probably be one peak because there are no obvious reasons why the prices of dog food would form different groups. b. Make a sketch of the distribution. Choose the correct answer below. O A. В. C. D.arrow_forward
arrow_back_ios
SEE MORE QUESTIONS
arrow_forward_ios
Recommended textbooks for you
 Glencoe Algebra 1, Student Edition, 9780079039897...AlgebraISBN:9780079039897Author:CarterPublisher:McGraw Hill
Glencoe Algebra 1, Student Edition, 9780079039897...
Algebra
ISBN:9780079039897
Author:Carter
Publisher:McGraw Hill
Hypothesis Testing using Confidence Interval Approach; Author: BUM2413 Applied Statistics UMP;https://www.youtube.com/watch?v=Hq1l3e9pLyY;License: Standard YouTube License, CC-BY
Hypothesis Testing - Difference of Two Means - Student's -Distribution & Normal Distribution; Author: The Organic Chemistry Tutor;https://www.youtube.com/watch?v=UcZwyzwWU7o;License: Standard Youtube License