
To show:
The profit maximizing price, output and economic profit on a graph representing
Explanation of Solution
Given information:
| Price | Quantity | TR | MR |
| 10 | 0 | 0 | - |
| 8 | 2000 | 16000 | 8 |
| 6 | 4000 | 24000 | 4 |
| 4 | 6000 | 24000 | 0 |
| 2 | 8000 | 16000 | -4 |
| 0 | 10000 | 0 | 8 |
The graph represnting the demand and marginal revenue curve is as shown below:
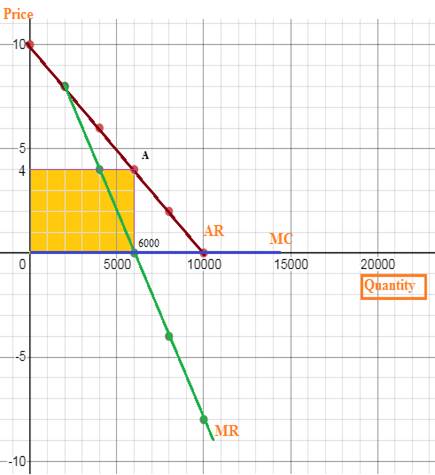
According to the diagram, the AR represents the demand curve while the marginal revenue curve is represented by the green line. Since the marginal cost is zero, the MC curve overlaps over the horizontal axis (blue color). Marginal revenue curve intersects the marginal cost curve at output level 6000 units (profit maximizing level) and at this point, the profit-maximizing price is 4 dollars. However, the area marked by the yellow color represents the economic profit.
Monopoly market is that market structure where a single firm enjoys the largest market share. The firm sells that commodity which has no close substitute and the entry for new firms in the monopoly market is very difficult.
Want to see more full solutions like this?
Chapter 16 Solutions
Foundations of Economics (8th Edition)

- On a graph, show the demand for Elixir water and Elixir Spring’s marginal revenue curve. What are Elixir’s profit-maximizing price, output, and economic profit?arrow_forwardThe graph shows the demand curve and marginal revenue curve of Java Time, Inc., a producer of espresso machines in monopolistic competition. Draw the firm's marginal cost curve if Java Time produces 125 espresso machines a week. Label it Draw a point at the profit-maximizing quantity and price. if average total cost at the profit-maximizing quantity is $100 a machine, what is Java Time's economic profit? Java Time's economic pro t is $ Selected: none ON 804 604 0 Price and cost (dollars per machine) 25 50 75 100 125 150 1175 200 225 250 2 Quantity (espresso machines per week) >>> Draw only the objects specified in the question ate Clear ?arrow_forwardAttempts 0 2. Calculating marginal revenue from a linear demand curve The blue curve on the following graph represents the demand curve facing a firm that can set its own prices. Use the graph input tool to help you answer the following questions. You will not be graded on any changes you make to this graph. Note: Once you enter a value in a white field, the graph and any corresponding amounts in each grey field will change accordingly. 160 140 120 100 A Demand 40 12 PRICE (Dollars per unit) 200 Keep the Highest 0/5 180 20 0 0 4 16 20 24 28 32 36 40 QUANTITY (Units) Graph Input Tool Market for Goods I Quanded (Units) Demand Price (Dollars per unit) 20 100.00 (?arrow_forward
- 4. Francois owns a motel and monopolizes motel rooms along a remote stretch of south Texas highway. In March, Francois stayed open even though he earned negative economic profits. a. Draw a correctly and thoroughly labeled graph for Francois' motel during March and include each of the following: i. The profit-maximizing quantity and price, labeled QF and PF ii. The average total cost curve, labeled ATC iii. The rectangle indicating the negative economic profit, lightly shaded. b. What explains explains why Francois continued operating during March even though he was earning negative economic profits? c. In April, the fixed costs for Francois' motel decrease. Would Francois' profit-maximizing quantity increase, decrease, or stay the same in April? Explain.arrow_forwardThe following graph shows Crest's demand curve, marginal-revenue (MR) curve, average-total-cost (ATC) curve, and marginal-cost (MC) curve. Use the black point (plus symbol) to indicate Crest's profit-maximizing output and price. (?) Price, Cost, Revenue Demand ATC O True MR Quantity of Crest Toothpaste True or False: Crest's profit is positive. + Profit Maxarrow_forward3. The components of marginal revenue Bob's Fire Engines is the sole seller of fire engines in the fictional country of Pyrotania. Initially, Bob produced five fire engines, but he has decided to increase production to six fire engines. The following graph shows the demand curve Bob faces. As you can see, to sell the additional engine, Bob must lower his price from $160,000 to $120,000 per fire engine. Note that while Bob gains revenue from the additional engine he sells, he also loses revenue from the initial five engines because he sells them all at the lower price. Use the purple rectangle (diamond symbols) to shade the area representing the revenue lost from the initial five engines by selling at $120,000 rather than $160,000. Then use the green rectangle (triangle symbols) to shade the area representing the revenue gained from selling an additional engine at $120,000. PRICE (Thousands of dollars per fire engine) 200 180 160 140 120 100 80 60 40 20 0 + 0 1 2 Bob in this scenario.…arrow_forward
- Please dont copy and paste the answers One of your former peers starts up a firm after graduating NYUAD. However, he didn’t take Markets so is unsure if he is behaving optimally. He’s asked you for help. His firm faces monopolistic competition, has diminishing returns to its inputs and uses a fixed input. He is producing at a quantity such that P=MC, and he makes a positive profit. a. Draw the Demand curve, MR, MC, and ATC reflecting this situation on a graph. Label the quantity, price and profit of the firm under his strategy. b. Is his strategy maximizing his profits? Explain how he would do so if not. Label the quantity, price and profit of the firm under the optimal strategy on your graph in part a. c. He asks you about what you predict might happen to his profits in the future. What do you expect will happen to profits in this industry as we go to long run and why? What is the key assumption of monopolistic competition that gives you your conclusion?arrow_forward2017 International Practice Exam FRQ Joyce owns a gas station and monopolizes gas sales along a remote stretch of road. In February, Joyce stayed open even though she earned negative economic profits. a. Draw a correctly labeled graph for Joyce's gas station during February and show each of the following. i. The profit-maximizing output and price, labeled QJ and PJ ii. The average total cost curve, labeled ATC iii. Deadweight loss, completely shaded b. What must have been true for Joyce to continue operating during the month of February even though she earned negative economic profit? c. Assume that fixed costs for Joyce's gas station decrease. Would Joyce's profit-maximizing quantity increase, decrease, or stay the same in February? Explain. d. During the month of July, demand increases so that Joyce now earns a positive economic profit. However, she realizes her profits would have been higher if she had reduced the price of gasoline. i. At the quantity sold in July, was marginal…arrow_forwardThe figure below shows the demand and costs facing Mike's Bikes, a producer of mountain bikes. What quantity does the firm produce and what is its price? Calculate the firm's economic profit or economic loss. Price and cost (dollars per bike) 400 350 300 250 200 150 100 50 MC ATC MR 100 200 Quantity (mountain bikes per week) Quantity produced is 100 mountain bikes per week, price of a mountain bike is $200 per bike, and economic loss is $10,000. Quantity produced is 100 mountain bikes per week, price of a mountain bike is $250 per bike, and economic loss is $5,000. Quantity produced is 100 mountain bikes per week, price of a mountain bike is $200 per bike, and economic profit is $5,000. Quantity produced is 100 mountain bikes per week, price of a mountain bike is $250 per bike, and economic profit is $5,000.arrow_forward
- Price and costs (dollars per book) 50 40 30 20 10 0 1 MR MC D 2 3 4 5 6 Quantity (thousands of books per year) Bob's Books is the only bookstore in town. The figure above shows the demand curve for books and Bob's Books' marginal revenue curve and marginal cost curve. Bob's Books maximizes its profit and sets the price of a book equal to revenue of and has total annualarrow_forward2. Entry or exit in the long run Fantastique Bikes is a company that manufactures bikes in a monopolistically competitive market. The following graph shows Fantastique's demand curve, marginal revenue curve (MR), marginal cost curve (MC), and average total cost curve (ATC). Place the black point (plus symbol) on the graph to indicate the short-run profit-maximizing price and quantity for this monopolistically competitive company. Then, use the green rectangle (triangle symbols) to shade the area representing the company's profit or loss. 500 450 Monopolistically Competitive Outcome 400 350 300 Profit or Loss A ATC 250 200 150 MC 100 50 MR Demand 50 100 150 200 250 300 350 400 450 500 QUANTITY (Bikes) Given the profit-maximizing choice of output and price, the shop is earning profit, which means there are shops in the industry than in long-run equilibrium. PRICE (Dollars per bike)arrow_forward1. Which of the following, in perfect competition, is most likely to shift a market’s supply curve to the right? The number of consumers decreases. The number of suppliers decreases. There is an improvement in production technology. The price of a substitute good increases. 2. Which of the following gives an example of an implicit cost for a bakery? The cost of flour used to make bread Bakeries have no implicit costs because they are monopolistically competitive. The foregone payments that could have been earned by renting out the bakery’s storefront to another firm The wages the bakery pays to its employees 3. A producer knows that the price elasticity of demand for his product is -0.67. He wants to increase quantity demanded by 33%. By what percentage does he need to change the price? -0.221 -2.03 -0.493 0.493arrow_forward
 Principles of Economics 2eEconomicsISBN:9781947172364Author:Steven A. Greenlaw; David ShapiroPublisher:OpenStax