
Videos
1(a)
Determine return on total assets for five years (20Y4 to 20Y8).
1(a)
Explanation of Solution
Financial Ratios: Financial ratios are the metrics used to evaluate the liquidity, capabilities, profitability, and overall performance of a company.
Return on assets determines the particular company’s overall earning power. It is determined by dividing sum of net income and interest expense and average total assets.
Formula:
1(b)
Determine return on
1(b)
Explanation of Solution
Formula:
1(c)
Determine times interest earned ratio for five years.
1(c)
Explanation of Solution
Times interest earned ratio quantifies the number of times the earnings before interest and taxes can pay the interest expense. First, determine the sum of income before income tax and interest expense. Then, divide the sum by interest expense.
Formula:
1(d)
Determine ratio of liabilities to stockholders’ equity for five years (20Y4 to 20Y8).
1(d)
Explanation of Solution
Ratio of liabilities to stockholders’ equity is determined by dividing liabilities and stockholders’ equity. Liabilities are determined as the difference between ending balance of assets and stockholders’ equity.
Formula:
Display the determined ratios in a graph.
Explanation of Solution
Return on total assets
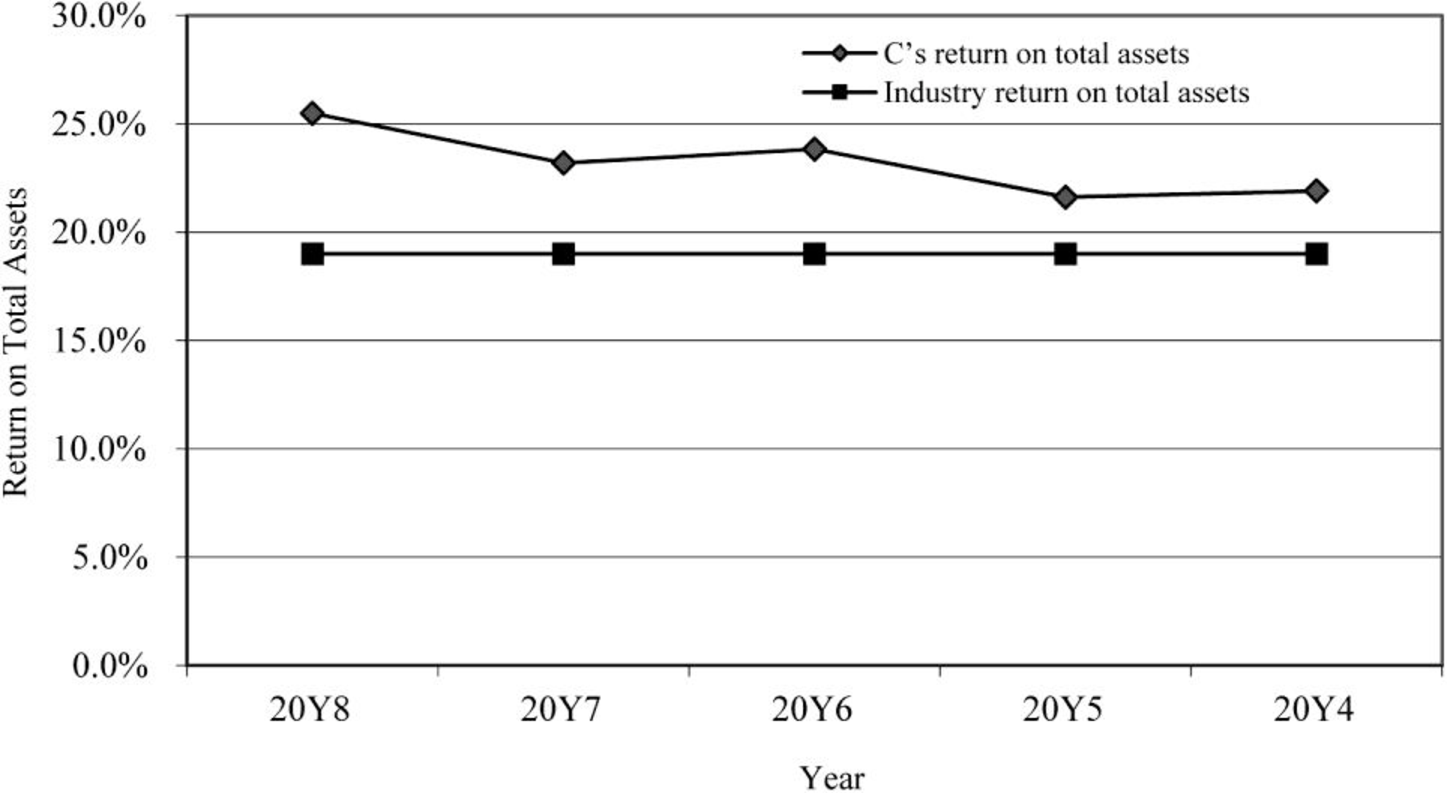
Figure (1)
Return on stockholders’ equity
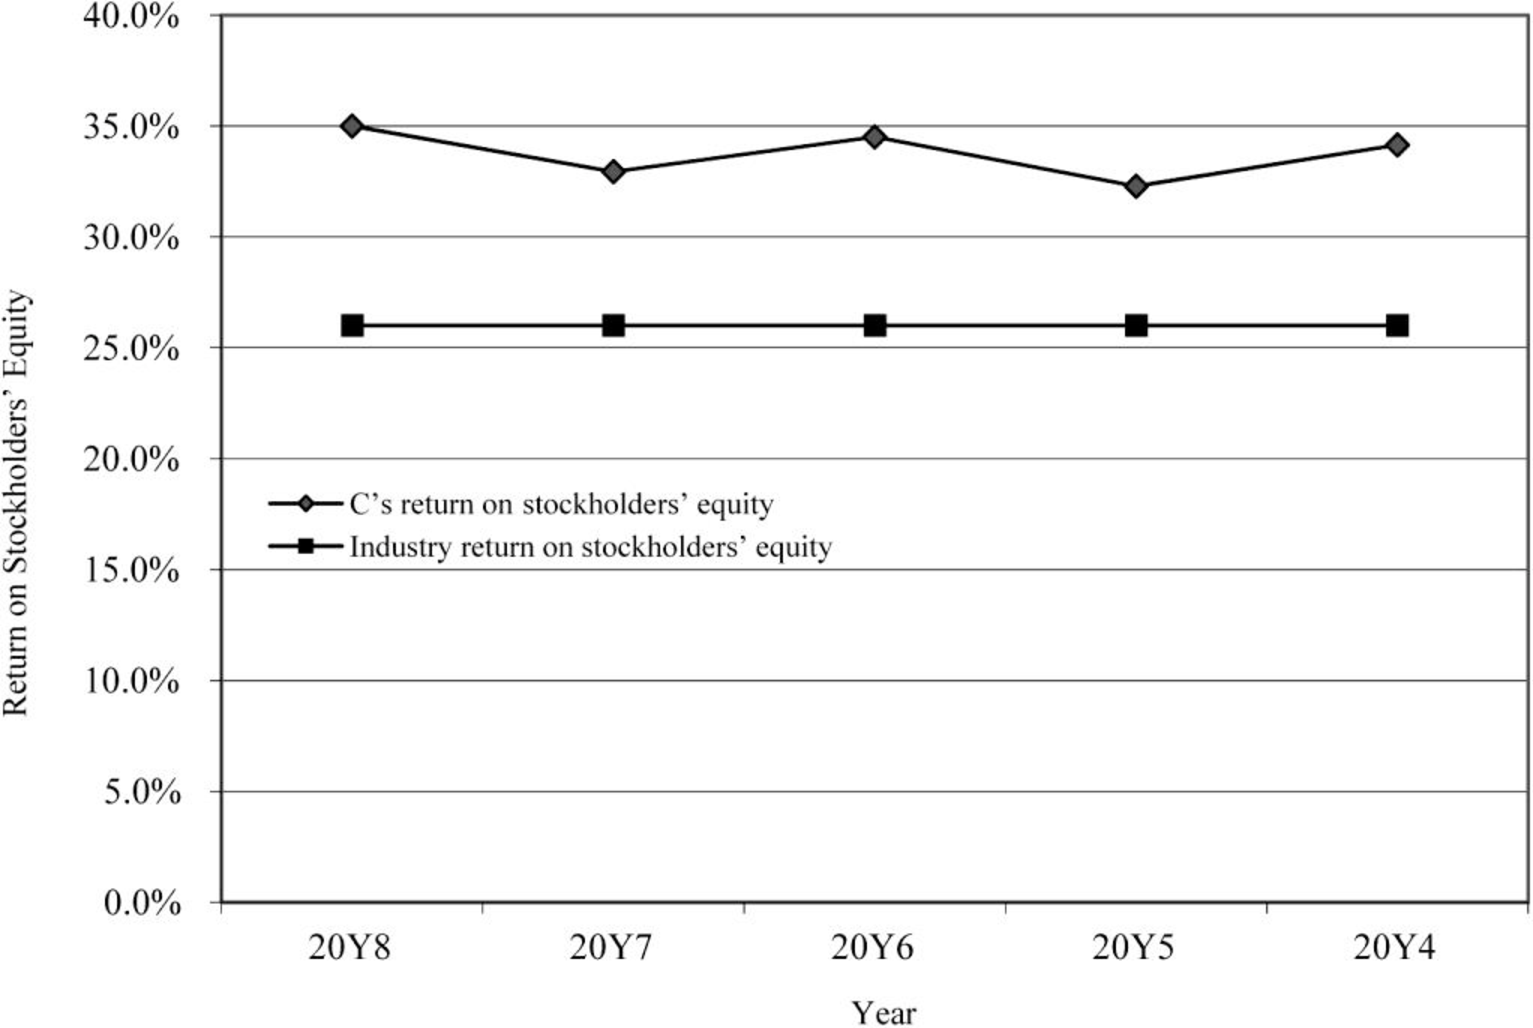
Figure (2)
Times interest earned ratio
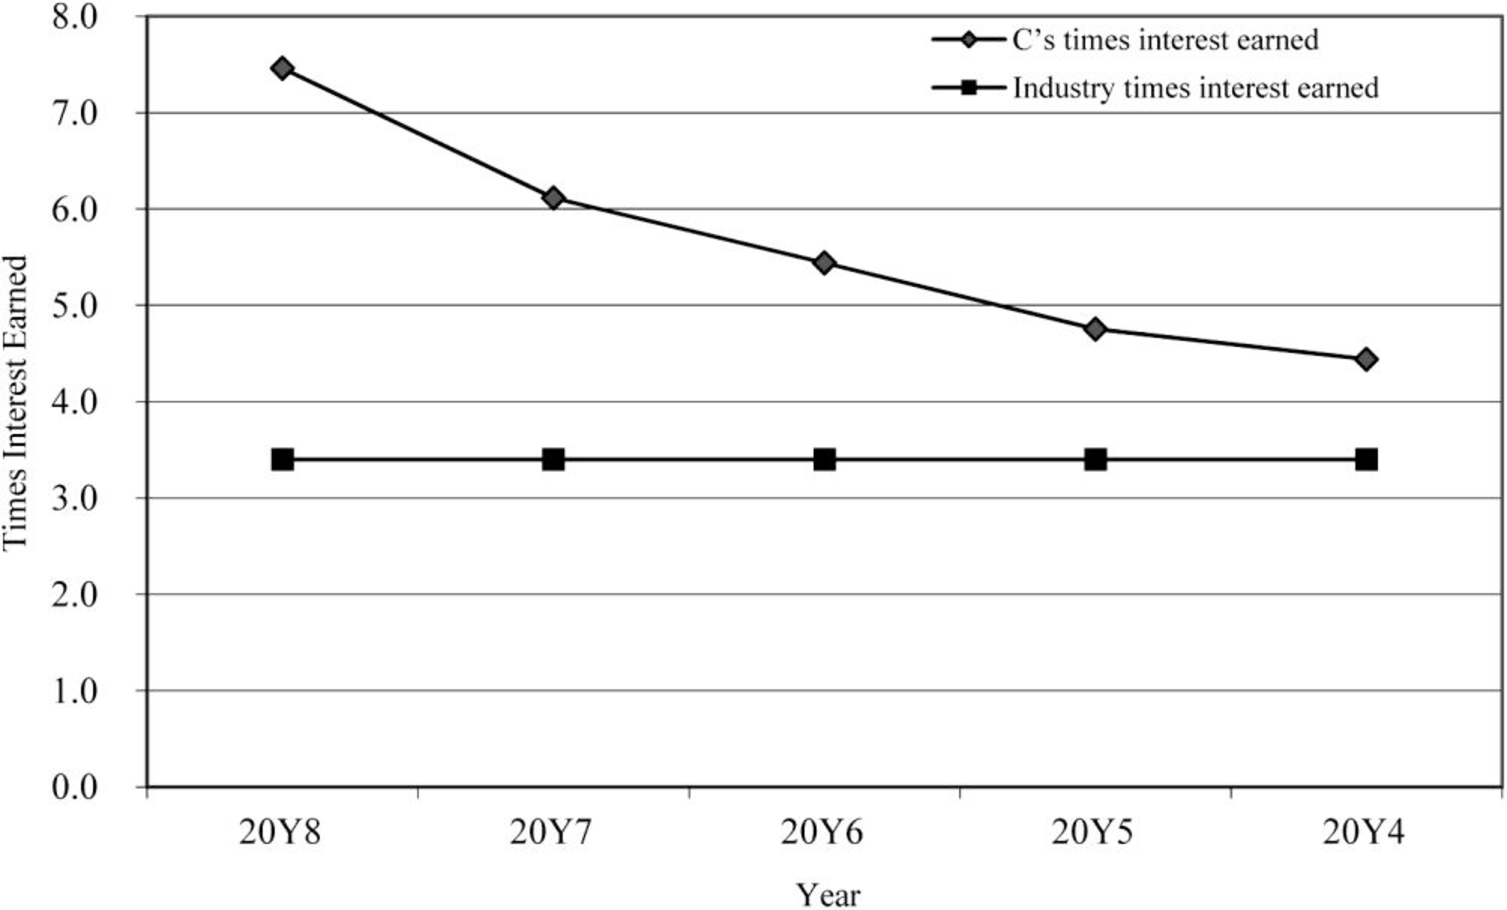
Figure (3)
Ratio of liabilities to stockholders’ equity
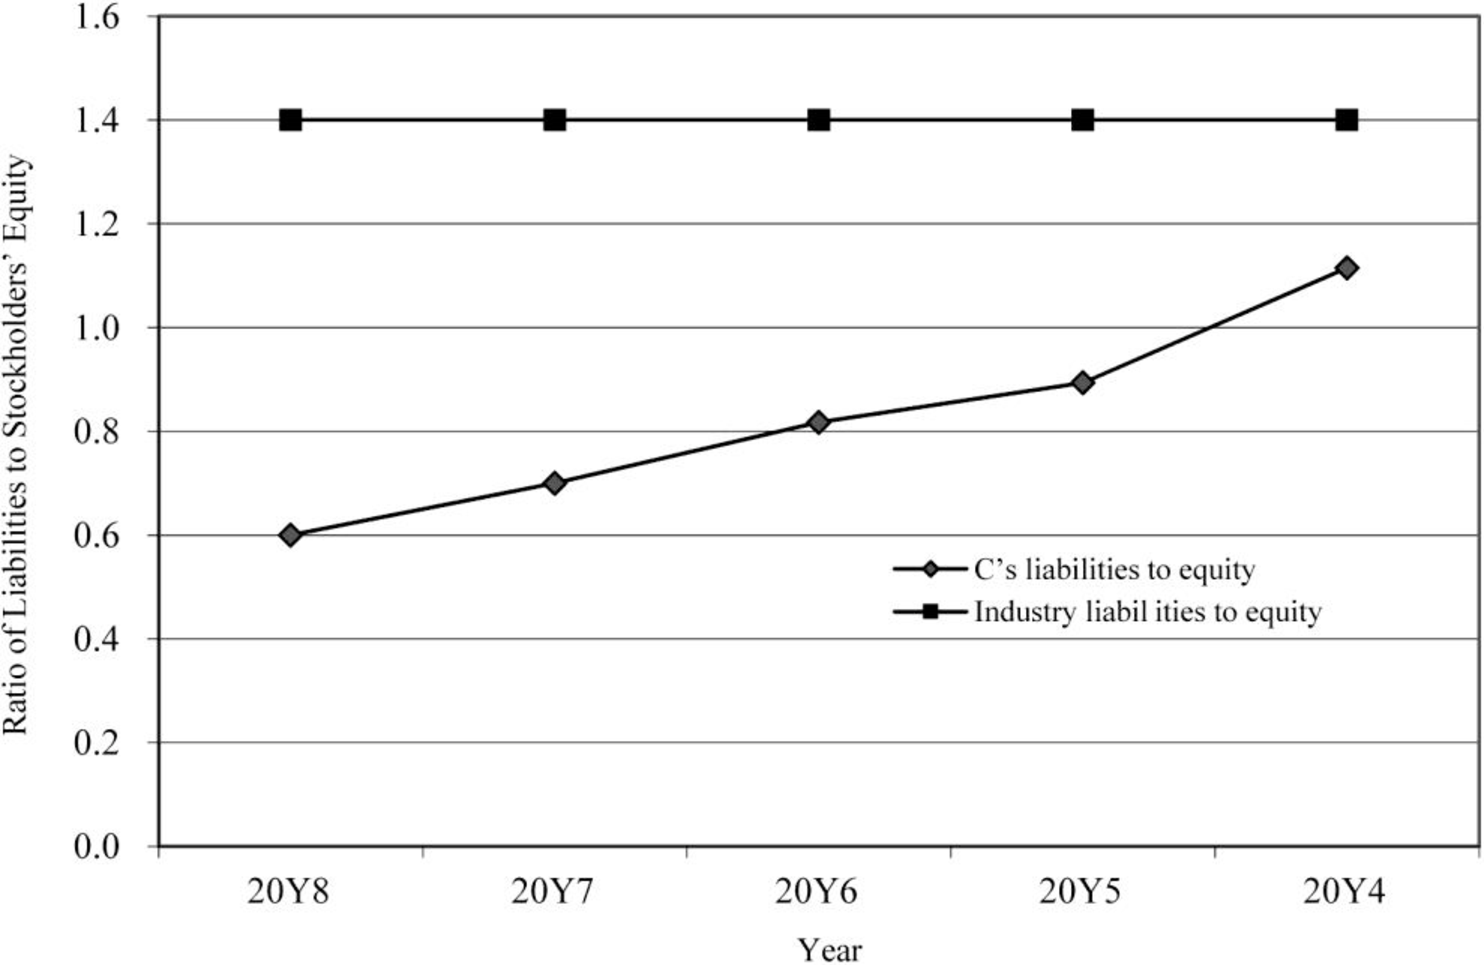
Figure (4)
2.
Prepare analysis of graphs.
2.
Explanation of Solution
Analysis:
- • The return on total assets and return on stockholders’ equity are in increasing trend for the last five years. There is a positive use of leverage. It is evident through the above ratios.
- • The ratio of liabilities to stockholders’ equity shows that the proportion of debt to stockholders’ equity is declining over the period.
- • The level of debt has been relative to the equity and has improved in the five years.
- • The times interest earned ratio is improving
- • g when compared to industry average.
Want to see more full solutions like this?
Chapter 16 Solutions
Managerial Accounting


- Juroe Company provided the following income statement for last year: Juroes balance sheet as of December 31 last year showed total liabilities of 10,250,000, total equity of 6,150,000, and total assets of 16,400,000. Required: 1. Calculate the return on sales. (Note: Round the percent to two decimal places.) 2. CONCEPTUAL CONNECTION Briefly explain the meaning of the return on sales ratio, and comment on whether Juroes return on sales ratio appears appropriate.arrow_forward5. Profitability ratios Profitability ratios help in the analysis of the combined impact of liquidity ratios, asset management ratios, and debt management ratios on the operating performance of a firm. Your boss has asked you to calculate the profitability ratios of Diusitech Inc. and make comments on its second-year performance as compared with its first-year performance. The following shows Diusitech Inc.'s income statement for the last two years. The company had assets of $4,700 million in the first year and $7,518 million in the second year. Common equity was equal to $2,500 million in the first year, and the company distributed 100% of its earnings out as dividends during the first and the second years. In addition, the firm did not issue new stock during either year. Diusitech Inc. Income Statement For the Year Ending on December 31 (Millions of dollars) Year 2 Year 1 2,540 2,000 1,610 1,495 127 80 1,737 803 80 723 181 542 Net Sales Operating costs except depreciation and…arrow_forwardProfitability ratios help in the analysis of the combined impact of liquidity ratios, asset management ratios, and debt management ratios on the operating performance of a firm. Your boss has asked you to calculate the profitability ratios of Spandust Industries Inc. and make comments on its second-year performance as compared with its first-year performance. The following shows Spandust Industries Inc.’s income statement for the last two years. The company had assets of $7,050 million in the first year and $11,278 million in the second year. Common equity was equal to $3,750 million in the first year, and the company distributed 100% of its earnings out as dividends during the first and the second years. In addition, the firm did not issue new stock during either year. Spandust Industries Inc. Income Statement For the Year Ending on December 31 (Millions of dollars) Year 2 Year 1 Net Sales 3,810 3,000 Operating costs except depreciation and amortization 1,855 1,723…arrow_forward
- Profitability ratios help in the analysis of the combined impact of liquidity ratios, asset management ratios, and debt management ratios on the operating performance of a firm. Your boss has asked you to calculate the profitability ratios of Dernham Inc. and make comments on its second-year performance as compared with its first-year performance. The following shows Dernham Inc. ’s income statement for the last two years. The company had assets of $3,525 million in the first year and $5,639 million in the second year. Common equity was equal to $1,875 million in the first year, and the company distributed 100% of its earnings out as dividends during the first and the second years. In addition, the firm did not issue new stock during either year. Dernham Inc. Income Statement For the Year Ending on December 31 (Millions of dollars) Year 2 Year 1 Net Sales 1,905 1,500 Operating costs except depreciation and amortization 1,855 1,723 Depreciation and amortization 95 60…arrow_forwardProfitability ratios help in the analysis of the combined impact of liquidity ratios, asset management ratios, and debt management ratios on the operating performance of a firm. Your boss has asked you to calculate the profitability ratios of Diusitech Inc. and make comments on its second-year performance as compared with its first-year performance. The following shows Diusitech Inc.’s income statement for the last two years. The company had assets of $10,575 million in the first year and $16,916 million in the second year. Common equity was equal to $5,625 million in the first year, and the company distributed 100% of its earnings out as dividends during the first and the second years. In addition, the firm did not issue new stock during either year. Diusitech Inc. Income Statement For the Year Ending on December 31 (Millions of dollars) Year 2 Year 1 Net Sales 5,715 4,500 Operating costs except depreciation and amortization 1,365 1,268 Depreciation and…arrow_forwardProfitability ratios help in the analysis of the combined impact of liquidity ratios, asset management ratios, and debt management ratios on the operating performance of a firm. Your boss has asked you to calculate the profitability ratios of St. McStanky Beer Co. and make comments on its second-year performance as compared with its first-year performance. The following shows St. McStanky Beer Co.'s income statement for the last two years. The company had assets of $3,525 million in the first year and $5,639 million in the second year. Common equity was equal to $1,875 million in the first year, and the company distributed 100% of its earnings out as dividends during the first and the second years. In addition, the firm did not issue new stock during either year. St. McStanky Beer Co. Income Statement For the Year Ending on ecember 31 (Millions of dollars) Year 2 Year 1 1,905 1,500 1,610 1,495 60 1,555 Net Sales Operating costs except depreciation and amortization Depreciation and…arrow_forward
- Profitability ratios help in the analysis of the combined impact of liquidity ratios, asset management ratios, and debt management ratios on the operating performance of a firm. Your boss has asked you to calculate the profitability ratios of Diusitech Inc. and make comments on its second-year performance as compared with its first-year performance. The following shows Diusitech Inc.'s income statement for the last two years. The company had assets of $8,225 million in the first year and $13,157 million in the second year. Common equity was equal to $4,375 million in the first year, and the company distributed 100% of its earnings out as dividends during the first and the second years. In addition, the firm did not issue new stock during either year. Diusitech Inc. Income Statement For the Year Ending on December 31 (Millions of dollars) Year 2 Year 1 4,445 1,120 222 1,342 3,103 310 2,793 698 2,095 Net Sales Operating costs except depreciation and amortization Depreciation and…arrow_forwardProfitability ratios help in the analysis of the combined impact of liquidity ratios, asset management ratios, and debt management ratios on the operating performance of a firm. Your boss has asked you to calculate the profitability ratios of Petroxy Oil Co. and make comments on its second-year performance as compared with its first-year performance. The following shows Petroxy Oll Co.'s Income statement for the last two years. The company had assets of $9,400 million in the first year and $15,037 million in the second year. Common equity was equal to $5,000 million in the first year, and the company distributed 100% of its earnings out as dividends during the first and the second years. In addition, the firm did not issue new stock during either year. Petroxy Oil Co. Income Statement For the Year Ending on December 31 (Millions of dollars) Year 2 Year 1 4,000 1,268 Net Sales Operating costs except depreciation and amortization Depreciation and amortization Total Operating Costs…arrow_forwardCompute the following profitability ratios of the company for the most recent two years, show all values in the computations: 1.Asset Turnover 2.Profit margin ratio(Net Income/Net Sales) 3.Return on total assets (Net Income/Average Total Assets) 4.Return on stockholders’ equity 5.Basic Earnings per share (EPS) Based on the results above, what conclusions can you make about the company’s overall profitability and efficient use of assets?arrow_forward
- Integrative: Complete ratio analysis Given the following financial statements E, historical ratios, and industry averages , calculate Sterling Company's financial ratios for the most recent year. (Assume a 365-day year.) Analyze its overall financial situation from both a cross-sectional and a time-series viewpoint. Break your analysis into evaluations of the firm's liquidity, activity, debt, profitability, and market. The current ratio is 1.59. (Round to two decimal places.) Data table Time-series analysis of the current ratio: Improving (Select from the drop-down menu.) Cross-sectional analysis of the current ratio: Poor (Select from the drop-down menu.) (Click the icon here O in order to copy the contents of the data table below into a spreadsheet.) The quick ratio is 0.84. (Round to two decimal places.) Historical and Industry Average Ratios for Sterling Company Ratio Actual 2020 Actual 2021 Industry average, 2022 Time-series analysis of the quick ratio: (Select from the drop-down…arrow_forwardProfitability ratios help in the analysis of the combined impact of liquidity ratios, asset management ratios, and debt management ratios on the operating performance of a firm. Your boss has asked you to calculate the profitability ratios of Petroxy Oil Co. and make comments on its second-year performance as compared with its first-year performance. The following shows Petroxy Oil Co.’s income statement for the last two years. The company had assets of $4,700 million in the first year and $7,518 million in the second year. Common equity was equal to $2,500 million in the first year, and the company distributed 100% of its earnings out as dividends during the first and the second years. In addition, the firm did not issue new stock during either year. Petroxy Oil Co. Income Statement For the Year Ending on December 31 (Millions of dollars) Year 2 Year 1 Net Sales 2,540 2,000 Operating costs except depreciation and amortization 1,610 1,495 Depreciation and…arrow_forwardProfitability ratios Your boss has asked you to calculate the profitability ratios of Triptych Food Corp. and make comments on its second-year performance as compared with its first-year performance. The following shows Triptych Food Corp.’s income statement for the last two years. The company had assets of $7,050 million in the first year and $11,278 million in the second year. Common equity was equal to $3,750 million in the first year, and the company distributed 100% of its earnings out as dividends during the first and the second years. In addition, the firm did not issue new stock during either year. Triptych Food Corp. Income Statement For the Year Ending on December 31 (Millions of dollars) Year 2 Year 1 Net Sales 3,810 3,000 Operating costs except depreciation and amortization 1,365 1,268 Depreciation and amortization 191 120 Total Operating Costs 1,556 1,388 Operating Income (or EBIT) 2,254 1,612 Less: Interest 304 169 Earnings before…arrow_forward
 Managerial AccountingAccountingISBN:9781337912020Author:Carl Warren, Ph.d. Cma William B. TaylerPublisher:South-Western College Pub
 Managerial Accounting: The Cornerstone of Busines...AccountingISBN:9781337115773Author:Maryanne M. Mowen, Don R. Hansen, Dan L. HeitgerPublisher:Cengage Learning