Concept explainers
(a)
The graph for the intensity curve of a blackbody having a temperature of
(a)
Answer to Problem 36Q
Solution:
Explanation of Solution
Introduction:
Wien’s law: Objects at different temperatures emit a spectrum that peaks at different wavelengths.
Explanation:
According to Wien’s law, wavelength is inversely proportional to temperature, so objects at different temperatures emit a spectrum that peaks at different wavelengths.
Now, as the wavelengths of the spectrum are different, the colors associated with those wavelengths will be different as well.
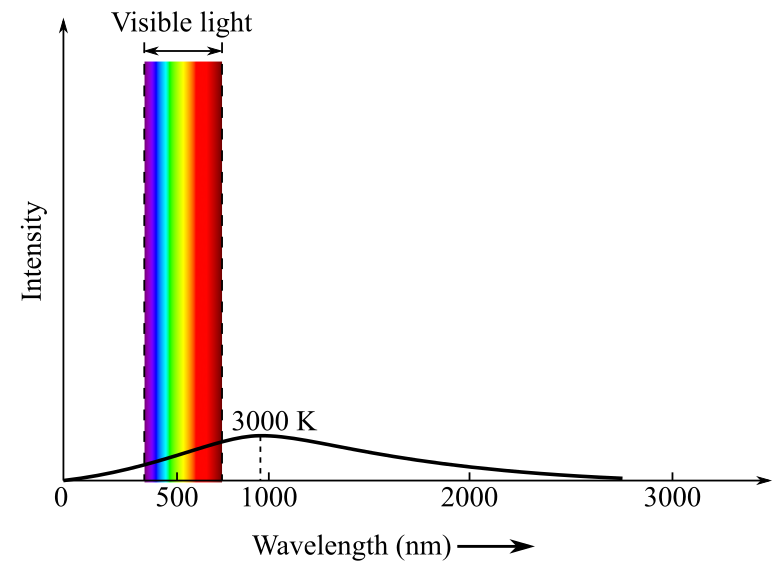
The intensity curve is plotted by representing wavelength on the horizontal axis and intensity on the vertical axis. So, for a temperature of
The curve will peak at around
The blackbody will appear red in color because the intensity of the
According to the above graph, the maximum intensity is for the red color, so the blackbody will appear red in color to us.
Conclusion:
The sketch shows that for a temperature of
(b)
The graph for the intensity curve of a blackbody having a temperature of
(b)
Answer to Problem 36Q
Solution:
Explanation of Solution
Introduction:
Wien’s law: Objects at different temperatures emit a spectrum that peaks at different wavelengths because the wavelength is inversely proportional to the temperature.
Explanation:
According to Wien’s law, objects at different temperatures emit a spectrum that peaks at different wavelengths.
As the wavelengths of the spectrum are different, the colors associated with those wavelengths will be different as well.
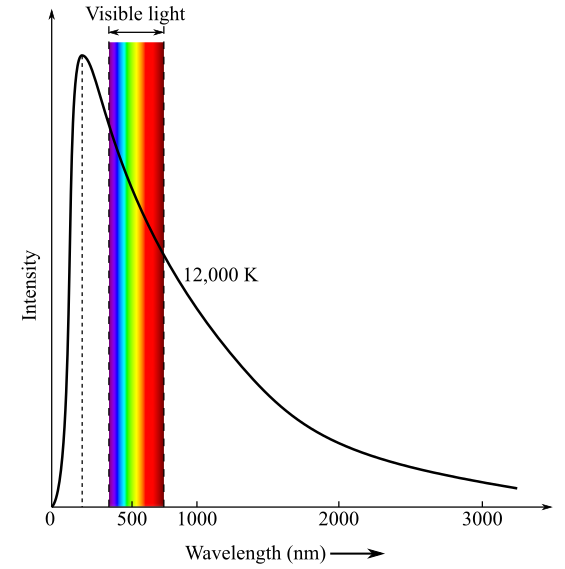
The intensity curve is plotted by representing wavelength on the horizontal axis and intensity on the vertical axis.
So, for a temperature of
The curve will peak at around
The black body will appear blue in color because the intensity of the radiation emitting from the blackbody is peaking at a shorter wavelength. The human eye can sense red, green, and blue colors.
According to the graph above, the maximum intensity is for the blue color, so the blackbody will appear blue in color to us.
Conclusion:
The sketch shows that for a temperature of
(c)
To explain: The reason behind color ratios
(c)
Answer to Problem 36Q
Solution:
For a relatively hot star, the value of brightness is in order
So, the ratios
Explanation of Solution
Introduction:
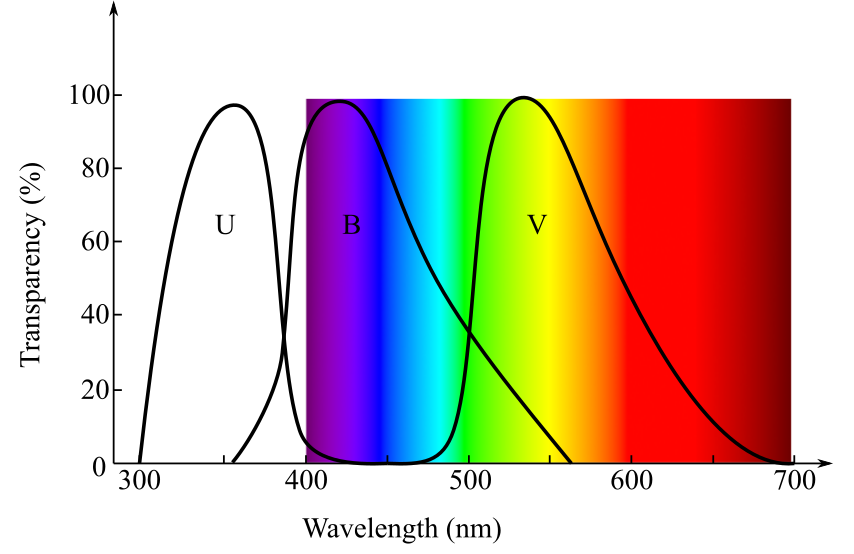
When a hot star is observed through the U (ultraviolet), V (yellow and green), and B (blue) filters, the intensity of the U filter will be higher than that of the B filter, and will be the dimmest when observed through the V filter.
Similarly, when a cold star is observed through U, V, and B filters, the intensity will be higher through the V filter than through the B filter, and it will be dimmest through U filter.
Explanation:
For a star of temperature
So, the value of the ratios
For a star of temperature
So, the value of the ratios
Conclusion:
Hot stars appear to be blue in color and cold stars appear to be red.
This is why when a hot star is observed through a B filter, the intensity is highest and similarly, when a cold star is observed through a V filter, the intensity is highest.
Want to see more full solutions like this?
Chapter 17 Solutions
Universe


- Would you expect to be able to detect an H II region in X-ray emission? Why or why not? (Hint: You might apply Wien’s law)arrow_forwardIf the emitted infrared radiation from Pluto, has a wavelength of maximum intensity at 75,000 nm, what is the temperature of Pluto assuming it follows Wien’s law?arrow_forwardExplain how we use spectral absorption and emission lines to determine the composition of a gas.arrow_forward
- As a star runs out of hydrogen to fuel nuclear fusion in its core, changes within the star usually cause it to leave the main sequence, expanding and cooling as it does so. Would a star with a radius 6 times that of the Sun, but a surface temperature 0.4 times that of the Sun, be more, or less luminous than the Sun? Show and explain your reasoning. You may assume the surface area of a sphere is A = 4πr2.arrow_forward(a) The colour temperature can be determined from two magnitudes corresponding to two different wavelengths. Show that: 7000 K Te (B-V)+0.47 The wavelengths ofthe B and V bands are 440 nm and 548 nm, respectively, and we assume that B=V for stars of the spectral class A0, the colour temperature of which is about 15000 K°. (Take constant value - 0.73 and e-2.718).arrow_forwardA)The star 58 Eridani is a feint but naked-eye star similar to the Sun. Suppose that you are observing this star in the night sky without a telescope. Ignoring any interstellar extinction or atmospheric absorption, approximately how many photons per second arrive at your retina? Show all steps in calculation . B) The Mid-infared Instrument (MIRI , camera and spectrograph ) on the James Webb Space Telescope operates in the band 5-28 µm . For 58 Eridani , approximatley how many photons per second can be used by this instrument ? Assume that MIRI takes all the photons from the full JWST mirror . Show all steps in calcultation . Describe breifly two or three other factors which play a role in determining the sensetivitu of an instrument such as MIRI ?arrow_forward
- The Stefan-Boltzmann equation can be used to estimate the size of asteroids. "Sigma," the Stefan-Boltzmann constant, is 5.67 x 10 Watts/m²K. If you want to abbreviate Plus 1.1415 You measure the infrared emission from an asteroid and conclude that it has a temperature of 249 K. Using rader you find the distance, and are then able to use your infrared brightness to determine a luminosity of 7.21E+12 Watts. If you assume the asteroid is roughly spherical, what is its radius in meters? CHECK ANSWERarrow_forwardImagine that you are observing a star and you find the wavelength of peak emission for the star to be 500 nm. What would the wavelength of peak emission be for a new star that has a surface temperature that is a third of the original star?arrow_forwarda) The star 58 Eridani is a feint but naked-eye star similar to the Sun. Suppose that you are observing this star in the night sky without a telescope. Ignoring any interstellar extinction or atmospheric absorption, approximately how many photons per second arrive at your retina? Show all steps in your calculation. Look up any required information about the star using Wikipedia. Use sensible approximations so your calculation is straightforward. For example you could consider only the region of the spectrum where the photon flux peaks. b) The Mid-Infrared Instrument (MIRI, camera and spectrograph) on the James Webb Space Telescope operates in the band 5 – 28 µm. For 58 Eridani, approximately how many photons per second can be used by this instrument? Assume that MIRI takes all the photons from the full JWST mirror. Show all steps in your calculation. Describe briefly two or three other factors which play a role in determining the sensitivity of an instrument such as MIRI?arrow_forward
- Cas A SNR North Lobe Chandra ACIS image (M. Stage) region of spectrum-> 10* km/s (be sure to convert your answer to kilometers!) (Enter a positive value--if you get a negative answer ignore the minus sign.) 1000 100 Combine counts / Ang./ (0.964324 sq. arcsec) 10 1 0.1 Cas A Ms Spectrum from 4362.5 4458.5, region size 0.964324 sq. arcsec Silicon line werden der 5 10 20 Wavelength (Angstroms) The speed of the material ejected in a supernova can be measured by using the Doppler shift of the X-ray emission lines in its spectrum. The images above show real X ray data of the Cassiopeia A supernova remnant and a spectrum extracted from that data--you can see several emission lines including the silicon line near 6.6 angstroms (0.66 nm). If the emission line created by silicon normally has a wavelength of 0.6648 nm (nanometers), but is measured in the spectrum to have a wavelength of 0.6599 nm, how fast is the gas moving?arrow_forward10:49 LTE O < All iCloud Imagine that you are observing a star and you find the wavelength of peak emission for the star to be 400 nm. What would the wavelength of peak emission be for a new star that has a surface temperature that is a quarter of the original star? Using the same pair of stars from the first question, ● how does the luminosity (the energy output) of each star compare if we assume that both stars are the same size? (Please provide a specific factor or proportion) What type of radiation/light (from the electromagnetic spectrum) is each star emitting? Now imagine that we determine that the wavelength of peak emission of the original star was determined to be bluer than it should be based on other observations. Would this indicate that the star is moving towards us or away from us relatively speaking through space? 0arrow_forwardCas A SNR North Lobe Chandra ACIS image (M. Stage) region of spectrum-> 104 km/s (be sure to convert your answer to kilometers!) (Enter a positive value--if you get a negative answer ignore the minus sign.) 1000 100 Combine counts / Ang./ (0.964324 sq. arcsec) 10 0.1 Cas A Ms Spectrum from 4362.5 4458.5, region size 0.964324 sq. arcsec Mapangh 5 Silicon line 10 20 Wavelength (Angstroms) The speed of the material ejected in a supernova can be measured by using the Doppler shift of the X-ray emission lines in its spectrum. The images above show real X ray data of the Cassiopeia A supernova remnant and a spectrum extracted from that data--you can see several emission lines including the silicon line near 6.6 angstroms (0.66 nm). If the emission line created by silicon normally has a wavelength of 0.6648 nm (nanometers), but is measured in the spectrum to have a wavelength of 0.6611 nm, how fast is the gas moving?arrow_forward
 AstronomyPhysicsISBN:9781938168284Author:Andrew Fraknoi; David Morrison; Sidney C. WolffPublisher:OpenStax
 Stars and Galaxies (MindTap Course List)PhysicsISBN:9781337399944Author:Michael A. SeedsPublisher:Cengage Learning
 Foundations of Astronomy (MindTap Course List)PhysicsISBN:9781337399920Author:Michael A. Seeds, Dana BackmanPublisher:Cengage Learning