Financial Accounting
15th Edition
ISBN: 9781337272124
Author: Carl Warren, James M. Reeve, Jonathan Duchac
Publisher: Cengage Learning
expand_more
expand_more
format_list_bulleted
Videos
Textbook Question
Chapter 17, Problem 6CP
The average liabilities, average
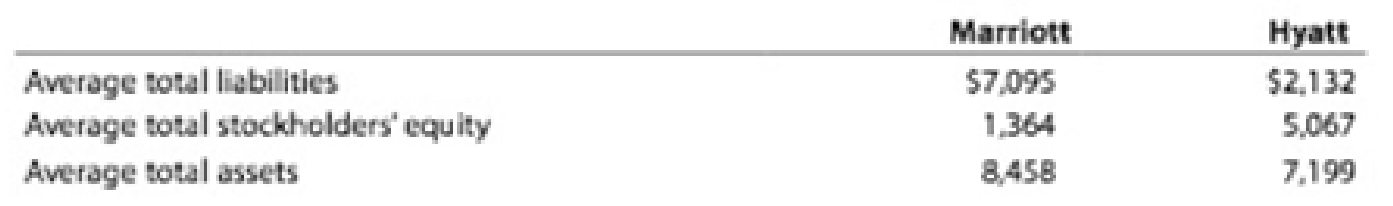
1. Determine the following ratios for both companies, rounding ratios and percentages to one decimal place:
- a. Return on total assets
- b. Return on stockholders' equity
- c. Times interest earned
- d. Ratio of total liabilities to stockholders' equity
2. Based on the information in (1), analyze and compare the two companies' solvency and profitability.
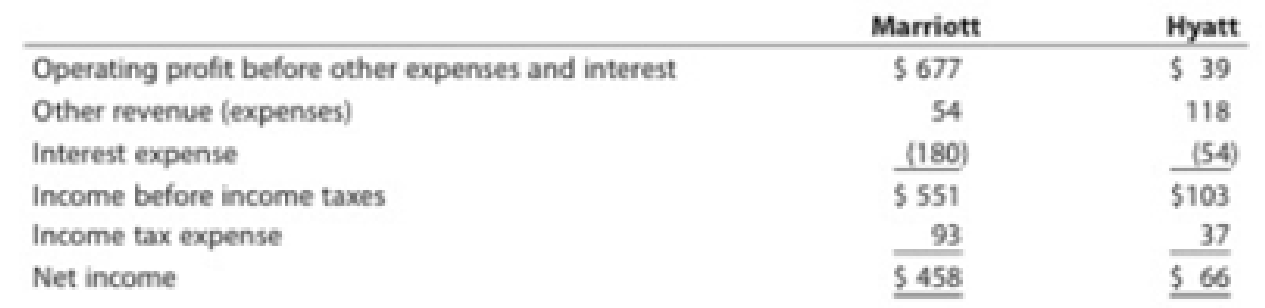
Comprehensive profitability and solvency analysis
Marriott International, Inc., and Hyatt Hotels Corporation are two major owners and managers of lodging and resort properties in the United States. Abstracted income statement information for the two companies is as follows for a recent year (in millions):
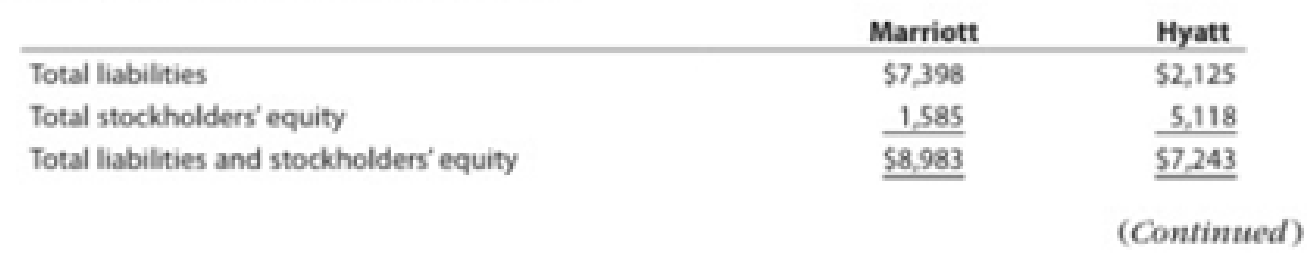
Balance sheet information is as follows:
Expert Solution & Answer
Want to see the full answer?
Check out a sample textbook solution
Students have asked these similar questions
Identify which of the following six metrics a through f best completes questions 1 through 3 below. a. Days’ sales uncollected d. Return on total assets b. Accounts receivable turnover e. Total asset turnover c. Working capital f. Profit margin 1. Which two ratios are key components in measuring a company’s operating efficiency? Which ratio summarizes these two components? 2. What measure reflects the difference between current assets and current liabilities? 3. Which two short-term liquidity ratios measure how frequently a company collects its accounts?
Calculate the following ratios:
Return on capital employed
Current ratio
Liquid ratio
Return on Equity
Gross Profit & Net Profit Margin
Give a brief report on the financial position of the company based on the above figures.
Compute the following profitability ratios of the company for the
most recent two years, show all values in the computations:
1.Asset Turnover
2.Profit margin ratio(Net Income/Net Sales)
3.Return on total assets (Net Income/Average Total Assets)
4.Return on stockholders’ equity
5.Basic Earnings per share (EPS)
Based on the results above, what conclusions can you make about the company’s overall profitability and efficient use of assets?
Chapter 17 Solutions
Financial Accounting
Ch. 17 - Prob. 1DQCh. 17 - What is the advantage of using comparative...Ch. 17 - Prob. 3DQCh. 17 - How would the current and quick ratios of a...Ch. 17 - Prob. 5DQCh. 17 - What do the following data, taken from a...Ch. 17 - a. How does the return on total assets differ from...Ch. 17 - Prob. 8DQCh. 17 - Prob. 9DQCh. 17 - Prob. 10DQ
Ch. 17 - Prob. 1PEACh. 17 - Prob. 1PEBCh. 17 - Prob. 2PEACh. 17 - Vertical analysis Income statement information for...Ch. 17 - Prob. 3PEACh. 17 - Prob. 3PEBCh. 17 - Prob. 4PEACh. 17 - Prob. 4PEBCh. 17 - Prob. 5PEACh. 17 - Inventory analysis A company reports the...Ch. 17 - Prob. 6PEACh. 17 - Prob. 6PEBCh. 17 - Times interest earned A company reports the...Ch. 17 - Times interest earned A company reports the...Ch. 17 - Asset turnover A company reports the following:...Ch. 17 - Asset turnover A company reports the following:...Ch. 17 - Prob. 9PEACh. 17 - Prob. 9PEBCh. 17 - Common stockholders' profitability analysis A...Ch. 17 - Common stockholders' profitability analysis A...Ch. 17 - Earnings per share and price-earnings ratio A...Ch. 17 - Earnings per share and price-earnings ratio A...Ch. 17 - Vertical analysis of income statement Revenue and...Ch. 17 - Prob. 2ECh. 17 - Common-sized income statement Revenue and expense...Ch. 17 - Prob. 4ECh. 17 - Prob. 5ECh. 17 - Current position analysis The following data were...Ch. 17 - Prob. 7ECh. 17 - Current position analysis The bond indenture for...Ch. 17 - Accounts receivable analysis The following data...Ch. 17 - Prob. 10ECh. 17 - Inventory analysis The following data were...Ch. 17 - Inventory analysis QT, Inc. and Elppa Computers,...Ch. 17 - Ratio of liabilities to stockholders equity and...Ch. 17 - Prob. 14ECh. 17 - Ratio of liabilities to stockholders equity and...Ch. 17 - Prob. 16ECh. 17 - Profitability ratios The following selected data...Ch. 17 - Profitability ratios Ralph Lauren Corporation...Ch. 17 - Six measures of solvency or profitability The...Ch. 17 - Five measures of solvency or profitability The...Ch. 17 - Earnings per share, price-earnings ratio, dividend...Ch. 17 - Prob. 22ECh. 17 - Earnings per share, discontinued operations The...Ch. 17 - Prob. 24ECh. 17 - Unusual items Explain whether Colston Company...Ch. 17 - Horizontal analysis of income statement For 20Y2,...Ch. 17 - Prob. 2PACh. 17 - Effect of transactions on current position...Ch. 17 - Measures of liquidity, solvency, and profitability...Ch. 17 - Solvency and profitability trend analysis Addai...Ch. 17 - Prob. 1PBCh. 17 - Prob. 2PBCh. 17 - Effect of transactions on current position...Ch. 17 - Prob. 4PBCh. 17 - Solvency and profitability trend analysis Crosby...Ch. 17 - Financial statement analysis The financial...Ch. 17 - Prob. 1CPCh. 17 - Prob. 3CPCh. 17 - Prob. 4CPCh. 17 - Prob. 5CPCh. 17 - The average liabilities, average stockholders'...
Knowledge Booster


Learn more about
Need a deep-dive on the concept behind this application? Look no further. Learn more about this topic, accounting and related others by exploring similar questions and additional content below.Similar questions
- Which of the following ratios is used to measure a firms profitability? a. Liabilities Ă· Equity c. Sales Ă· Assets b. Assets Ă· Equity d. Net Income Ă· Net Salesarrow_forwardUsing the following Balance Sheet summary information, calculate for the two companies presented: A. working capital B. current ratio Then: A. evaluate which companys liquidity position appears stronger, and why.arrow_forwardDefine each of the following terms: Liquidity ratios: current ratio; quick, or acid test, ratio Asset management ratios: inventory turnover ratio; days sales outstanding (DSO); fixed assets turnover ratio; total assets turnover ratio Financial leverage ratios: debt ratio; times-interest-earned (TIE) ratio; EBITDA coverage ratio Profitability ratios: profit margin on sales; basic earning power (BEP) ratio; return on total assets (ROA); return on common equity (ROE) Market value ratios: price/earnings (P/E) ratio; price/cash flow ratio; market/book (M/B) ratio; book value per share Trend analysis; comparative ratio analysis; benchmarking DuPont equation; window dressing; seasonal effects on ratiosarrow_forward
- ANALY SIS OF PROFITABILITY Based on the financial statement data in Exercise 24-1A, compute the following profitability measures for 20-2 (round all calculations to two decimal places): (a) Profit margin ratio (b) Return on assets (c) Return on common stockholders equity (d) Earnings per share of common stockarrow_forwardRatio Analysis Consider the following information. Required: Calculate the stockholder payout ratios. (Note: Round answers to two decimal places.) Calculate the stockholder profitability ratios. (Note: Round answers to two decimal places.)arrow_forwardWhat are the two most common receivables ratios, and what do these ratios tell a stakeholder about the company?arrow_forward
- Assess the relative profitability of the company (as benchmarked with competitors) using the following ratios: gross profit margin net profit margin return on assets return on equityarrow_forwarddetermine the following ratios for both companies, then based on the information analvze and compare the two companies' solvency and profitability. Ratios: Return on total assets Return on stockholders' equity Times interest earned Ratio of total liabilities to stockholders' equity.arrow_forwardWhich of the following ratios best measures the profitability of a company? a) Return on equity b) Gross margin c) Current ratio d) Net operating asset turnoverarrow_forward
- - Please refer to the following Income Statement and Balance Sheet (see attached picture): Prepare a vertical analysis for both the income statement and balance sheet. Write a paragraph comparing the company’s performance with the industry average. Compute the following ratios and comment on what the results mean when evaluating the company: Current ratio Gross profit percentage ratio Debt ratio Profit margin ratioarrow_forwardFrom the given Statement of Financial Position and Income statement, solve for the following: 1) Compute the FINANCIAL ratios that measure: c) Operating Activity -Accounts Receivable Turnover -Days Sales in Receivable -Inventory Turnover -Days in Inventory d) Profitability -Earnings per Share -Return on Asset -Return on Equity -Operating Profit Margin -Net Profit Margin 2) Analyze, interpret, and draw conclusions based on the results of your computations.arrow_forward5. Profitability ratios Profitability ratios help in the analysis of the combined impact of liquidity ratios, asset management ratios, and debt management ratios on the operating performance of a firm. Your boss has asked you to calculate the profitability ratios of Diusitech Inc. and make comments on its second-year performance as compared with its first-year performance. The following shows Diusitech Inc.'s income statement for the last two years. The company had assets of $4,700 million in the first year and $7,518 million in the second year. Common equity was equal to $2,500 million in the first year, and the company distributed 100% of its earnings out as dividends during the first and the second years. In addition, the firm did not issue new stock during either year. Diusitech Inc. Income Statement For the Year Ending on December 31 (Millions of dollars) Year 2 Year 1 2,540 2,000 1,610 1,495 127 80 1,737 803 80 723 181 542 Net Sales Operating costs except depreciation and…arrow_forward
arrow_back_ios
SEE MORE QUESTIONS
arrow_forward_ios
Recommended textbooks for you
 Financial AccountingAccountingISBN:9781337272124Author:Carl Warren, James M. Reeve, Jonathan DuchacPublisher:Cengage Learning
 EBK CONTEMPORARY FINANCIAL MANAGEMENTFinanceISBN:9781337514835Author:MOYERPublisher:CENGAGE LEARNING - CONSIGNMENT
 Intermediate Financial Management (MindTap Course...FinanceISBN:9781337395083Author:Eugene F. Brigham, Phillip R. DavesPublisher:Cengage Learning
 College Accounting, Chapters 1-27AccountingISBN:9781337794756Author:HEINTZ, James A.Publisher:Cengage Learning,
 Cornerstones of Financial AccountingAccountingISBN:9781337690881Author:Jay Rich, Jeff JonesPublisher:Cengage Learning
Financial Accounting
Accounting
ISBN:9781337272124
Author:Carl Warren, James M. Reeve, Jonathan Duchac
Publisher:Cengage Learning
EBK CONTEMPORARY FINANCIAL MANAGEMENT
Finance
ISBN:9781337514835
Author:MOYER
Publisher:CENGAGE LEARNING - CONSIGNMENT
Intermediate Financial Management (MindTap Course...
Finance
ISBN:9781337395083
Author:Eugene F. Brigham, Phillip R. Daves
Publisher:Cengage Learning
College Accounting, Chapters 1-27
Accounting
ISBN:9781337794756
Author:HEINTZ, James A.
Publisher:Cengage Learning,
Cornerstones of Financial Accounting
Accounting
ISBN:9781337690881
Author:Jay Rich, Jeff Jones
Publisher:Cengage Learning
How To Analyze an Income Statement; Author: Daniel Pronk;https://www.youtube.com/watch?v=uVHGgSXtQmE;License: Standard Youtube License