Fundamentals of Geotechnical Engineering (MindTap Course List)
5th Edition
ISBN: 9781305635180
Author: Braja M. Das, Nagaratnam Sivakugan
Publisher: Cengage Learning
expand_more
expand_more
format_list_bulleted
Concept explainers
Videos
Textbook Question
Chapter 2, Problem 2.8P
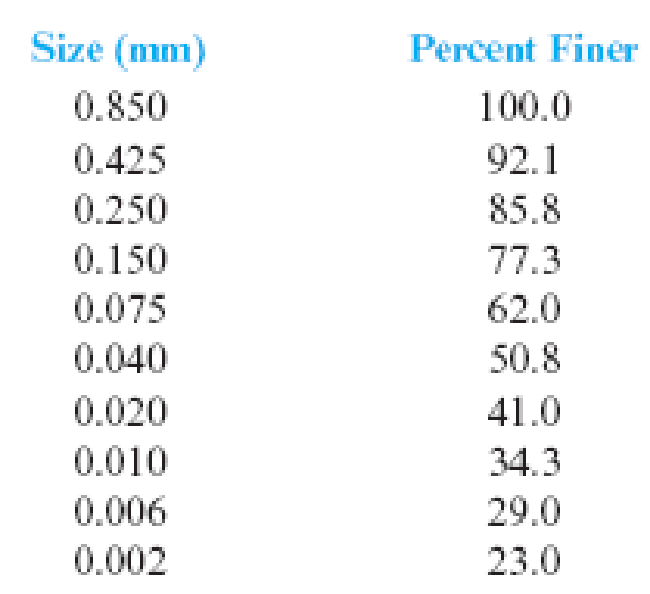
Redo Problem 2.7 according to the USDA system (Table 2.3).
2.7 The particle characteristics of a soil are given below. Draw the particle-size distribution curve and find the percentages of gravel, sand, silt, and clay according to the MIT system (Table 2.3).
Expert Solution & Answer

Trending nowThis is a popular solution!

Students have asked these similar questions
7. Following details regarding the particle size distribution and other index properties pertinent to the classification of soil. Choose three soils and classify
each soil according to USCS and AASHTO classification systems. When necessary, assume Cu = 4.48 and Cc = 1.22. Your solution may be presented in similar
form as what was included in your module 4.
Sieve Analysis (Percent Finer)
Soil No
Liquid Limit
Plastic Limit
No. 10
No. 40
No. 200
98
80
50
38
29
2
100
92
80
56
23
100
88
65
37
22
4
85
55
45
28
20
92
75
62
43
28
6
48
28
N.A.
NP
7
87
62
30
32
24
8
90
76
34
37
25
100
78
8
N.A.
NP
10
92
74
32
44
35
7. Following details regarding the particle size distribution and other index properties pertinent to the classification of soil. Choose three soils and classify
each soil according to USCS and AASHTO classification systems. When necessary, assume Cu = 4.48 and C = 1.22. Your solution may be presented in similar
form as what was included in your module 4.
Sieve Analysis (Percent Finer)
Soil No
Liquid Limit
Plastic Limit
No. 10
No. 40
No. 200
1
98
80
50
38
29
2
100
92
80
56
23
3
100
88
65
37
22
4
85
55
45
28
20
5
92
75
62
43
28
6
48
28
6
N.A.
NP
7
87
62
30
32
24
8
90
76
34
37
25
9
100
78
8
N.A.
NP
10
92
74
32
44
35
Please answer this problem using the AASHTO
system. NOT the MIT system. Thank you!
The particle characteristics of a soil are given below. Draw the particle-size
distribution curve and find the percentages of gravel, sand, silt, and clay
Size (mm)
Percent Finer
0.850
100.0
0.425
92.1
0.250
85.8
0.150
77.3
0.075
62.0
0.040
50.8
0.020
41.0
0.010
34.3
29.0
0.006
0.002
23.0
Chapter 2 Solutions
Fundamentals of Geotechnical Engineering (MindTap Course List)
Ch. 2 - Prob. 2.1PCh. 2 - Following are the results of a sieve analysis: a....Ch. 2 - For a soil, given: D10 = 0.08 mm D30 = 0.22 mm D60...Ch. 2 - For a soil, given: D10 = 0.08 mm D30 = 0.22 mm D60...Ch. 2 - Repeat Problem 2.2 with the following results of a...Ch. 2 - Repeat Problem 2.2 with the following results of a...Ch. 2 - The particle characteristics of a soil are given...Ch. 2 - Redo Problem 2.7 according to the USDA system...Ch. 2 - Redo Problem 2.7 according to the AASHTO system...Ch. 2 - In a hydrometer test, the results are as follows:...
Knowledge Booster


Learn more about
Need a deep-dive on the concept behind this application? Look no further. Learn more about this topic, civil-engineering and related others by exploring similar questions and additional content below.Similar questions
- Repeat Problem 2.11 with the following data. 2.11 The grain-size characteristics of a soil are given in the following table. a. Draw the grain-size distribution curve. b. Determine the percentages of gravel, sand, silt, and clay according to the MIT system. c. Repeat Part b using the USDA system. d. Repeat Part b using the AASHTO system.arrow_forwardThe particle characteristics of a soil are given below. Draw the particle-size distribution curve and find the percentages of gravel, sand, silt, and clay according to the MIT system (Table 2.3).arrow_forwardThe particle size characteristics of a soil are given in the table. Using USDA method, determine: Size (mm) Percent Finer 4.75 98 0.85 95 0.044 36 0.033 32 0.0062 19 0.0025 9. 0.0011 1. Percentage of gravel (in 4 decimal places) 2. Percentage of sand (in 4 decimal places) 3. Percentage of silt (in 4 decimal places) 4. Percentage of clay (in 4 decimal places)arrow_forward
- A 500g (assume no wastes) of dry soil was used for a soil mechanical analysis. The mass of soil retained in each sieve, and hydrometer analysis data are given in Table 1 and Table 2, respectively. a. what is the value of the effective size of soil in mm? b. what is the value of the coefficient of gradation? c. what are the percentages of grave sand silt and clay using the limits indicated by USDAarrow_forwardRedo Problem 2.7 according to the AASHTO system (Table 2.3). 2.7 The particle characteristics of a soil are given below. Draw the particle-size distribution curve and find the percentages of gravel, sand, silt, and clay according to the MIT system (Table 2.3).arrow_forwardThere are four soil samples used for a laboratory research study. After performing the sieve analysis and hydrometer analysis, the results are plotted and tabulated (as shown in the following slides). Please refer to the Grain Size Distribution Graph and Table to answer the problems below (show your solution). a. Determine the D60, D30, and D10 for Soils 1, 2, 3 and 4. b. Determine the coefficient of uniformity for Soils 1, 2, 3 and 4. c. Determine the coefficient of gradation for Soils 1, 2, 3 and 4. d. Determine the percentage of gravels, sands, and fines according to Unified Soil Classification System for Soils 1, 2, 3, and 4. e. Which one is coarser: Soil 1 or Soil 2? Justify your answer. A SILLIMAN UNIVERSITY & COLLEGE OF ENGINEERING AND DESIGN DEPARTMENT OF CIVIL ENGINEERING Lecturer: Dr. Christine Langcuyan-Berquist, R.CE, M.Eng, D.Eng Long Quiz No. 02: CE 36 - Geotechnical Engineering I 17 March 2022, Thursday MacBook Pro % & 5 6 9. %3D T Y P 11 G J K M * C0arrow_forward
- 2. The particle size characteristics of a soil is given at the table below. Classify the soil using Textural Classification System/USDA. Size (mm) Percent Finer 100 0.425 0.100 92 0.052 84 0.020 62 0.010 46 0.004 32 0.001 22arrow_forwardQuestion Answer Calculate the percentage of sand when the 40 second hydrometer reading is 35 g; assume a 60 g soil sample is used. Calculate the percentage of clay when the 8 hour hydrometer reading is 8 g; assume a 60 g soil sample is used. If 280 g of soil of particles less than 2 mm in diameter |contains 50 g of particles less than 0.002 mm in diameter, what is the percent of clay in this soil?arrow_forwardThe sieve analysis of ten soils and the liquid and plastic limits of the fraction passing through the No. 40 sieve are given below. • Classify the soils by the AASHTO classification system and give the group index for each soil. Sieve analysis--Percent finer Soil No. 10 No. 40 No. 200 Liquid limit Plasticity index 1 98 80 50 38 29 100 92 80 56 23 100 88 65 37 22 4. 85 55 45 28 20 92 75 62 43 28 6. 97 60 30 25 16 7. 100 55 8 NP 8. 94 80 63 40 21 9. 83 48 20 20 15 10 100 92 86 70 38arrow_forward
- 4.16 Plot the particle size distribution curve for each of the three soils the data for which are given below. All three curves should be on the same semi logarithmic diagram. Sieve Number 3/4 in ½ in #4 # 10 # 20 # 40 # 60 # 100 # 200 Particle Diameter from Hydrometer Analysis (mm) Lagoon Clay Beufort, SC 0.045 0.010 0.005 0.001 Data from Sowers (1979). 100 100 100 100 100 100 100 95 80 61 42 37 27 % Passing by Weight Beach Sand Daytona Beach, FL 100 100 100 100 100 98 90 10 2 Weathered Tuff Central America 100 98 95 93 88 82 75 72 68 66 33 21 10 4.17 Determine Cu and Cc for each of the three soils in Problem 4.17. Which of these soils is most well-grazied? Why?arrow_forward4.16 Plot the particle size distribution curve for each of the three soils the data for which are given below. All three curves should be on the same semi logarithmic diagram. Sieve Number 3/4 in ½ in #4 # 10 # 20 # 40 # 60 # 100 # 200 Particle Diameter from Hydrometer Analysis (mm) Lagoon Clay Beufort, SC 0.045 0.010 0.005 0.001 Data from Sowers (1979). 100 100 100 100 100 100 100 95 80 61 42 37 27 % Passing by Weight Beach Sand Daytona Beach, FL 100 100 100 100 100 98 90 10 2 Weathered Tuff Central America 100 98 95 93 88 82 75 72 68 66 33 21 10 4.17 Determine Cu and Ce for each of the three soils in Problem 4.17. Which of these soils is most well-graded? Why?arrow_forwardThe results of particle size analyses and, where appropriate, limit tests on samples of four soils are given in Table Q1. Allot group symbols and give main and qualifying terms appropriate for each soil. Table Q1 Percentage smaller Sieve Particle size size Soil A Soil B Soil C Soil D 20mm 100 6.3mm 94 100 2mm 69 98 600µm 32 88 100 212µm 13 67 95 100 63 μη 2 37 73 99 0.020mm 22 46 88 0.006mm 11 25 71 0.002mm 4 13 58 Liquid limit Non-plastic 32 78 Plastic limit 24 31 a) Draw the particle size distribution curve for four samples. b) Determine the coefficients of uniformity and curvature for soil A and B. c) Allot group symbols and give main and qualifying terms appropriate for soil A. d) Allot group symbols and give main and qualifying terms appropriate for soil B. e) Allot group symbols and give main and qualifying terms appropriate for soil C. f) Allot group symbols and give main and qualifying terms appropriate for soil D.arrow_forward
arrow_back_ios
SEE MORE QUESTIONS
arrow_forward_ios
Recommended textbooks for you
 Fundamentals of Geotechnical Engineering (MindTap...Civil EngineeringISBN:9781305635180Author:Braja M. Das, Nagaratnam SivakuganPublisher:Cengage Learning
 Principles of Geotechnical Engineering (MindTap C...Civil EngineeringISBN:9781305970939Author:Braja M. Das, Khaled SobhanPublisher:Cengage Learning
Fundamentals of Geotechnical Engineering (MindTap...
Civil Engineering
ISBN:9781305635180
Author:Braja M. Das, Nagaratnam Sivakugan
Publisher:Cengage Learning
Principles of Geotechnical Engineering (MindTap C...
Civil Engineering
ISBN:9781305970939
Author:Braja M. Das, Khaled Sobhan
Publisher:Cengage Learning
How Are Highways Designed?; Author: Practical Engineering;https://www.youtube.com/watch?v=9XIjqdk69O4;License: Standard Youtube License