
Concept explainers
Videos
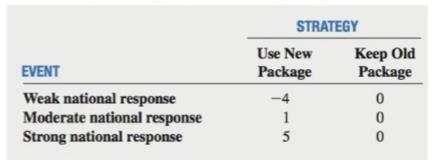
The manufacturer of a nationally distributed brand of potato chips wants to determine the feasibility of changing the product package from a cellophane bag to an unbreakable container. The product manager believes that there are three possible national market responses to a change in product package: weak. moderate. and strong. The projected payoffs, in millions of dollars, in increased or decreased pro�t compared to the current package are as follows:
Based on past experience. the product manager assigns the following probabilities to the different levels of national response:
P(Weak national response)
P(Moderate national response)
P(Strong national response)
a. Construct a decision tree,
b. Construct an opportunity loss table.
c. Compute the expected monetary value (EMV) for offering this new product package.
d. Compute the expected opportunity loss (EOL) for offering this new product package.
e. Explain the meaning of the
f. Compute the return-to-risk ratio (RTRR) for offering this new product package.
g. Based on the results of (c), (d), and (f), should the company offer this new product package? Why?
h. What are your answers to parts (c) through (g) if the probabilities are 0.6, 0.3, and 0.1, respectively?
i. What are you answer to parts (c) through (g) if the probabilities are 0.1, 0.3, and 0.6, respectively?
Before making a �nal decision, the product manager would like to test market the new package in a selected city by substituting the new package for the o1d package. A determination can then be made about whether sales have increased, decreased, or stayed the same. In previous test marketing of other products, when there was a subsequent weak national response, sales in the test city decreased
j. If sales in the test city stayed the same, revise the original probabilities in light of this new information.
k. Use the revised probabilities in (j) to repeat (c) through (g).
1. 1f sales in the test city decreased. revise the original probabilities in light of this new information.
m. In. Use the revised probabilities in (1) to repeat (0) through (g).
Want to see the full answer?
Check out a sample textbook solution
Chapter 20 Solutions
Basic Business Statistics, Student Value Edition (13th Edition)
Additional Math Textbook Solutions
Statistics Through Applications
EBK STATISTICAL TECHNIQUES IN BUSINESS
The Practice of Statistics for AP - 4th Edition
Elementary Statistics Using Excel (6th Edition)
Introductory Statistics (2nd Edition)


- An insurance company offers four different deductible levels-none, low, medium, and high-for its homeowner's policyholders and three different levels-low, medium, and high-for its automobile policyholders. The accompanying table gives proportions for the various categories of policyholders who have both types of insurance. For example, the proportion of individuals with both low homeowner's deductible and low auto deductible is 0.08 (8% of all such individuals). Homeowner's N L M H Auto 0.04 0.08 0.05 0.01 0.07 0.11 0.20 0.09 н 0.02 0.03 0.15 0.15 Suppose an individual having both types of policies is randomly selected. (a) What is the probability that the individual has a medium auto deductible and a high homeowner's deductible? (b) What is the probability that the individual has a low auto deductible? A low homeowner's deductible? auto deductible homeowner's deductible (c) What is the probability that the individual is in the same category for both auto and homeowner's deductibles?…arrow_forwardAn insurance company offers four different deductible levels-none, low, medium, and high-for its homeowner's policyholders and three different levels-low, medium, and high-for its automobile policyholders. The accompanying table gives proportions for the various categories of policyholders who have both types of insurance. For example, the proportion of individuals with both low homeowner's deductible and low auto deductible is 0.08 (8% of all such individuals). Homeowner's Auto N L H L 0.04 0.08 0.05 0.02 0.07 0.11 0.20 0.08 H. 0.02 0.03 0.15 0.15 Suppose an individual having both types of policies is randomly selected. What is the probability that the individual has a medium auto deductible and a high homeowner's deductible? What is the probability that the individual has a low auto deductible? A low homeowner's deductible? auto deductible homeowner's deductible What is the probability that the individual is in the same category for both auto and homeowner's deductibles? Based on…arrow_forwardAn insurance company offers four different deductible levels-none, low, medium, and high-for its homeowner's policyholders and three different levels-low, medium, and high-for its automobile policyholders. The accompanying table gives proportions for the various categories of policyholders who have both types of insurance. For example, the proportion of individuals with both low homeowner's deductible and low auto deductible is 0.05 (5% of all such individuals). Auto L M H Homeowner's NLMH 0.04 0.05 0.05 0.02 0.07 0.09 0.20 0.13 0.02 0.03 0.15 0.15 Suppose an individual having both types of policies is randomly selected. (a) What is the probability that the individual has a medium auto deductible and a high homeowner's deductible? (b) What is the probability that the individual has a low auto deductible? A low homeowner's deductible? auto deductible homeowner's deductible (c) What is the probability that the individual is in the same category for both auto and homeowner's deductibles?…arrow_forward
- An insurance company offers four different deductible levels-none, low, medium, and high-for its homeowner's policyholders and three different levels-low, medium, and high-for its automobile policyholders. The accompanying table gives proportions for the various categories of policyholders who have both types of insurance. For example, the proportion of individuals with both low homeowner's deductible and low auto deductible is 0.05 (5% of all such individuals). Homeowner's N L M н Auto L 0.04 0.05 0.05 0.02 M 0.07 0.11 0.20 0.11 0.02 0.03 0.15 0.15 Suppose an individual having both types of policies is randomly selected. (a) What is the probability that the individual has a medium auto deductible and a high homeowner's deductible? (b) What is the probability that the individual has a low auto deductible? A low homeowner's deductible? auto deductible homeowner's deductible (c) What is the probability that the individual is in the same category for both auto and homeowner's deductibles?…arrow_forwardAn insurance company offers four different deductible levels-none, low, medium, and high-for its homeowner's policyholders and three different levels-low, medium, and high-for its automobile policyholders. The accompanying table gives proportions for the various categories of policyholders who have both types of insurance. For example, the proportion of individuals with both low homeowner's deductible and low auto deductible is 0.05 (5% of all such individuals). Auto L M H Homeowner's N L M H 0.04 0.05 0.05 0.02 0.07 0.12 0.20 0.10 0.02 0.03 0.15 0.15 Suppose an individual having both types of policies is randomly selected. (a) What is the probability that the individual has a medium auto deductible and a high homeowner's deductible? (b) What is the probability that the individual has a low auto deductible? A low homeowner's deductible? auto deductible homeowner's deductible (c) What is the probability that the individual is in the same category for both auto and homeowner's…arrow_forward
 MATLAB: An Introduction with ApplicationsStatisticsISBN:9781119256830Author:Amos GilatPublisher:John Wiley & Sons Inc
 Probability and Statistics for Engineering and th...StatisticsISBN:9781305251809Author:Jay L. DevorePublisher:Cengage Learning
 Statistics for The Behavioral Sciences (MindTap C...StatisticsISBN:9781305504912Author:Frederick J Gravetter, Larry B. WallnauPublisher:Cengage Learning
 Elementary Statistics: Picturing the World (7th E...StatisticsISBN:9780134683416Author:Ron Larson, Betsy FarberPublisher:PEARSON
 The Basic Practice of StatisticsStatisticsISBN:9781319042578Author:David S. Moore, William I. Notz, Michael A. FlignerPublisher:W. H. Freeman
 Introduction to the Practice of StatisticsStatisticsISBN:9781319013387Author:David S. Moore, George P. McCabe, Bruce A. CraigPublisher:W. H. Freeman