
Principles of Economics 2e
2nd Edition
ISBN: 9781947172364
Author: Steven A. Greenlaw; David Shapiro
Publisher: OpenStax
expand_more
expand_more
format_list_bulleted
Textbook Question
Chapter 24, Problem 59CTQ
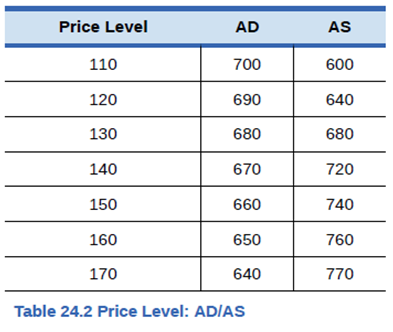
Review the problem in the Work It Out titled “Interpreting the AD/AS Model.” Like the information provided in that feature, Table 24.2 shows information on
- Plot the AD/AS diagram from the data. Identify the equilibrium.
- Imagine that, as a result of a government tax cut, aggregate demand becomes higher by 50 at every price level. Identify the new equilibrium.
- How will the new equilibrium alter output? How will it alter the price level? What do you think will happen to employment?
Expert Solution & Answer

Trending nowThis is a popular solution!

Students have asked these similar questions
Review the problem shown in the Work It Out titled "Interpreting the AD/AS Model." Like the information provided in that feature, Table 24.2 shows information on aggregate supply, aggregate demand, and the price level for the imaginary country of Xurbia.
Price Level
AD
AS
110
700
600
120
690
640
130
680
680
140
670
720
150
660
740
160
650
760
170
640
770
Table24.2 Price Level: AD/AS
Plot the AD/AS diagram from the data shown. Identify the equilibrium.
Imagine that, as a result of a government tax cut, aggregate demand becomes higher by 50 at every price level. Identify the new equilibrium.
How will the new equilibrium alter output? How will it alter the price level? What do you think will happen to employment?
Use AD/AS model to solve the following problems. You have to DRAW and explain AD/AS model. Hydraulic fracturing (
fracking) has the potential to significantly increase the amount of natural gas produced in the United States. Assume a
large percentage of factories and utility companies use natural gas. Scenario A: the economy is operating at full
employment level of output. Scenario B: The economy is operating below full employment. what will happen to output,
the price level, and employment as fracking becomes more widely used? LO1: Analyze the dynamic economic
environment using economic notions and theories. LO2: Explain consumer and producer behavior and economic
decision-making of economic units under different market structures. LO3: Describe and interpret measures of
macroeconomic performance including potential efficiencies, government actions, and market forces.
The table below shows information on aggregate supply, aggregate demand and the price level for the imaginary country of Xurbia.
Price Level
AD
AS
110
700
600
120
690
640
130
680
680
140
670
720
150
660
740
160
650
760
170
640
770
Plot the AD/AS diagram from the data shown (Don't have to show graph but do draw it to help you answer the questions).
a. Identify the equilibrium.
b. Imagine that as a result of a government tax cut, aggregate demand becomes higher by 50 at every price level. Identify the new equilibrium.
c. How will the new equilibrium alter output? How will it alter the price level? What do you think will happen to employment?
Chapter 24 Solutions
Principles of Economics 2e
Ch. 24 - Describe the mechanism by which supply creates its...Ch. 24 - Describe the mechanism by which demand creates its...Ch. 24 - The short run aggregate supply curve was...Ch. 24 - In the AD/AS model, what prevents the economy from...Ch. 24 - Suppose the U.S. Congress passes significant...Ch. 24 - Suppose concerns about the size of the federal...Ch. 24 - How would a dramatic increase in the value of the...Ch. 24 - Suppose Mexico, one of our largest trading...Ch. 24 - A policymaker claims that tax cuts led the economy...Ch. 24 - Many financial analysts and economists eagerly...
Ch. 24 - What impact would a decrease in the size of the...Ch. 24 - Suppose, after five years of sluggish growth, the...Ch. 24 - Suppose the Federal Reserve begins to Increase the...Ch. 24 - If the economy is operating in the neoclassical...Ch. 24 - If the economy is operating In the Keynesian zone...Ch. 24 - What is says law?Ch. 24 - What is Keynes; law?Ch. 24 - Do neoclassical economists believe in Keynes law...Ch. 24 - Does Says law apply more accurately in the long...Ch. 24 - What is on the horizontal axis of the AD/AS...Ch. 24 - What is the economic reason why the SRAS curve...Ch. 24 - What are the components of the aggregate demand...Ch. 24 - What are the economic reasons why the AD curve...Ch. 24 - Briefly explain the reason for the near-horizontal...Ch. 24 - Briefly explain the reason for the near-vertical...Ch. 24 - What is potential GDP?Ch. 24 - Name some factors that could cause the SRAS curve...Ch. 24 - Will the shift of SRAS to the right tend to make...Ch. 24 - What is stagflation?Ch. 24 - Name some factors that could cause AD to shift,...Ch. 24 - Would a shift of AD to the right tend to make the...Ch. 24 - How is long-term growth illustrated in an AD/AS...Ch. 24 - How is recession illustrated in an AD/AS model?Ch. 24 - How is cyclical unemployment illustrated in an...Ch. 24 - How is the natural rate of unemployment...Ch. 24 - How is pressure for inflationary price increases...Ch. 24 - What are some of the ways in which exports and...Ch. 24 - What is the Keynesian zone of the SRAS curve? How...Ch. 24 - What is the neoclassical zone of the SRAS curve?...Ch. 24 - What is the intermediate zone of the SRAS curve?...Ch. 24 - Why would an economist choose either the...Ch. 24 - On a microeconomic demand curve, a decrease in...Ch. 24 - Economists expect that as the labor market...Ch. 24 - If new government regulations require firms to use...Ch. 24 - During spring 2016 the Midwestern United States,...Ch. 24 - Hydraulic fracturing (tracking) has the potential...Ch. 24 - Some politicians have suggested tying the minimum...Ch. 24 - If households decide to save a larger portion of...Ch. 24 - If firms become more optimistic about the future...Ch. 24 - If Congress cuts taxes at the same time that...Ch. 24 - Suppose the level of structural unemployment...Ch. 24 - If foreign wealth-holders decide that the United...Ch. 24 - The AD/AS model is static. It shows a snapshot of...Ch. 24 - Explain why the short-run aggregate supply curve...Ch. 24 - Explain why the short-run aggregate supply curve...Ch. 24 - Why might it be important for policymakers to know...Ch. 24 - In your view, is the economy currently operating...Ch. 24 - Are Says law and Keynes law necessarily mutually...Ch. 24 - Review the problem in the Work It Out titled...Ch. 24 - The imaginary country of Harris Island has the...Ch. 24 - Table 24.4 describes Santhers economy. Plot the...
Additional Business Textbook Solutions
Find more solutions based on key concepts
Ravenna Candles recently purchased candleholders for resale in its shops. Which of the following costs would be...
Financial Accounting (12th Edition) (What's New in Accounting)
Use the following standard cost card for 1 gallon of ice cream to answer the questions. Actual direct costs inc...
Principles of Accounting Volume 2
What is the best way to control labor costs? What tools are discussed in the chapter that may be used to help c...
Construction Accounting And Financial Management (4th Edition)
Discussion Questions 1. What characteristics of the product or manufacturing process would lead a company to us...
Managerial Accounting (5th Edition)
What are the four elements of the budgeting cycle?
Horngren's Cost Accounting: A Managerial Emphasis (16th Edition)
E3-27 Identifying the impact of adjusting entries on the financial statements
Learning Objectives 3,5
Aus...
Horngren's Accounting (12th Edition)
Knowledge Booster

Similar questions
- What are some of the ways in which exports and imports can affect the AD/AS model?arrow_forwardUse the following scenario for the next two questions. Suppose that the federal government decides to forgive all current (and future) outstanding student loans (estimated to total around $1.6 trillion as of early 2020). When thinking about the AD/AS model, which curve would this shift in the short-run, and in which direction? AD curve, to the left AD curve, to the right OSRAS curve only, to the right OSRAS and AD curves, to the left. OSRAS and LRAS curves, to the leftarrow_forwardGraphically show the likely short-run impact on US real GDP and aggregate price level using the AD/AS model. Explain your prediction. Which curve in the AD/AS model would a change in US consumer consumption affect? Note:- Please avoid using ChatGPT and refrain from providing handwritten solutions; otherwise, I will definitely give a downvote. Also, be mindful of plagiarism. Answer completely and accurate answer. Rest assured, you will receive an upvote if the answer is accurate.arrow_forward
- Assume that the United States' macroeconomic equilibrium is equal to the potential GDP. Americans are becoming more cautious with their household spending due to the uncertainty of the presidency of Donald Trump. Using the AD-AS model, explain carefully the immediate and long-term effects of the event on the economy. Draw the appropriate AD-AS diagram to support your explanation.arrow_forwardUse AD/AS model to solve the following problem. You are expected to: 1. DRAW and explain with AD/AS model. Hydraulic fracturing (fracking) has the potential to significantly increase the amount of natural gas produced in the United States. Assume a large percentage of factories and utility companies use natural gas. In the following two scenarios, what will happen to output, the price level, and employment as fracking becomes more widely used? Scenario A: the economy is operating at full employment level of ouptput. Scenario B: The economy is operating below full employment.arrow_forwardThe imaginary country of Harris Island has the aggregate supply and aggregate demand curves as Table 24.3 shows. a. Identify the (i) equilibrium basing from the AD/AS diagram attached. b. Would you expect unemployment in this economy to be relatively high or low? c. Would you expect concern about inflation in this economy to be relatively high or low? d. Imagine that consumers begin to lose confidence about the state of the economy, and so AD becomes lower by 275 at every price level. Identify the new aggregate equilibrium. e. How will the shift in AD affect the original output, price level, and employment?arrow_forward
- Using a macroeconomics demand/supply analysis, where do you think current output is relative to what the economy is capable of producing? Look at recent trends in the data. What are the recent trends in the components of aggregate demand (consumption spending, investment spending, government purchases, and exports and imports?arrow_forwardIf workers look around and see prices rising more quickly than they had planned for, what is the likely effect on their real wage? And what does that imply for income and employment? Again, use the AD/AS model's chart or equations.arrow_forwardHow does AD/AS Model Incorporates Economic Growth, unemployment, and inflation. Identify periods of economic growth and recession using the AD/AS models. Explain how unemployment and inflation impact the AD/AS model. Evaluate the importance of AD/AS models from a macroeconomic standpoint and analysis.arrow_forward
- (Note: All your answers should be rounded to the nearest hundredth. Example: 12.034 =>12.03, 5.175=>5.18) For each of the following situations, use an AD/AS model to describe what happens to price levels and output in the United States in the short run. In each case assume the economy starts in long- and short-run equilibrium, and show the appropriate shifts in the AS or AD curves. Suppose that the AD and AS curves are given as: AD: AS: P=6.1-0.2 Y(GDP) P= -1 +0.15 Y(GDP) Using Excel create a spreadsheet with the column headings Y, AD,JAS, G, and T. Let's start with no change in G, and T. Fill in the spreadsheet's cells for Y= 19.0 to Y= 21.0 in increments of 0.1. What is the equilibrium GDP? What is the equilibrium P? Now, there is a decrease in Tax (T), i.e., tax cut by $1 (trillion). It is assumed that an 1 unit decrease in T shifts the AD curve to the right by 0.08 units. If P and Y (GDP) won't change immediately, what happens to the nation's output? (surplus, shortage, or no…arrow_forwardHello Can you help me out. Use the AD/AS model to illustrate the following. Draw 6 graphs by hand. Show how the AD or the AS curve shift and in what direction (left or right). Also state what happens to equilibrium real GDP (Y), employment, and the equilibrium price level. [Note: Use the SRAS curve, not the LRAS.] A. an increase in government spending and/or transfer payments B. restrictive fiscal policy C. expansive monetary policy D. increase in investment according to Keynesians E. increase in investment according to supply-side economists F. a stock market crasharrow_forwardUse the AD/AS model to explain the likely short run impacts on US GDP and the aggregate price level. What do you anticipate will happen to US consumption expenditure and US employment?arrow_forward
arrow_back_ios
SEE MORE QUESTIONS
arrow_forward_ios
Recommended textbooks for you

 Economics (MindTap Course List)EconomicsISBN:9781337617383Author:Roger A. ArnoldPublisher:Cengage Learning
 Exploring EconomicsEconomicsISBN:9781544336329Author:Robert L. SextonPublisher:SAGE Publications, Inc
 Principles of Economics 2eEconomicsISBN:9781947172364Author:Steven A. Greenlaw; David ShapiroPublisher:OpenStax
Economics (MindTap Course List)
Economics
ISBN:9781337617383
Author:Roger A. Arnold
Publisher:Cengage Learning
Exploring Economics
Economics
ISBN:9781544336329
Author:Robert L. Sexton
Publisher:SAGE Publications, Inc
Principles of Economics 2e
Economics
ISBN:9781947172364
Author:Steven A. Greenlaw; David Shapiro
Publisher:OpenStax