
Principles of Economics 2e
2nd Edition
ISBN: 9781947172364
Author: Steven A. Greenlaw; David Shapiro
Publisher: OpenStax
expand_more
expand_more
format_list_bulleted
Textbook Question
Chapter 26, Problem 21P
Use Table 26.3 to answer the following questions.
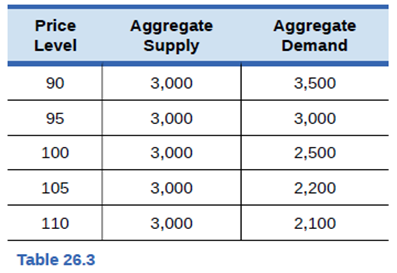
- Sketch an aggregate supply and aggregate demand diagram.
- What is the equilibrium output and
price level? - If aggregate demand shifts right, what is equilibrium output?
- If aggregate demand shifts left, what is equilibrium output?
- In this scenario, would you suggest using aggregate demand to alter the level of output or to control any inflationary increases in the price level?
Expert Solution & Answer

Trending nowThis is a popular solution!

Students have asked these similar questions
Are the determinants of aggregate demand the same things that apply to demand for an individual good?
The following graph plots aggregate demand (AD2027AD2027) and aggregate supply (AS) for the imaginary country of Cotopaxi in the year 2027.
Suppose the natural level of output in this economy is $6 trillion.
On the following graph, use the green line (triangle symbol) to plot the long-run aggregate supply (LRAS) curve for this economy.
Economists forecast that if the government takes no action and the economy continues to grow at the current rate, aggregate demand in 2028 will be given by the curve labeled ADAADA, resulting in the outcome given by point A. If, however, the government pursues an expansionary policy, aggregate demand in 2028 will be given by the curve labeled ADBADB, resulting in the outcome given by point B.
The following table presents projections for the unemployment rates that would occur at point A and point B. Consider the potential rate of inflation between 2027 and 2028, depending on whether the economy moves from the initial price level of 102 to the…
Use the following graph to answer the following questions.
Line Y
Price level
(P)
100
80
B
Line Z
Line X2
Line X1
Real GDP
(3)
If point A occurs chronologically before point B, then this graph could represent
a decrease in aggregate demand with a decrease in long-run and short-run aggregate supply.
a decrease in aggregate demand with constant long-run and short-run aggregate supply.
constant aggregate demand with a decline in long-run aggregate supply.
an increase in aggregate demand with constant long-run and short-run aggregate supply.
constant aggregate demand with a decline in short-run aggregate supply.
Chapter 26 Solutions
Principles of Economics 2e
Ch. 26 - Do rational expectations tend to look back at past...Ch. 26 - Legislation proposes that the government should...Ch. 26 - Would it make sense to argue that rational...Ch. 26 - Summarize the Keynesian and Neoclassical models.Ch. 26 - Does neoclassical economics focus on the long term...Ch. 26 - Does neoclassical economics view prices and wages...Ch. 26 - What shape is the long-nm aggregate supply curve?...Ch. 26 - What is the difference between rational...Ch. 26 - A neoclassical economist and a Keynesian economist...Ch. 26 - Do neoclassical economists tend to focus more on...
Ch. 26 - Do neoclassical economists tend to focus more on...Ch. 26 - Do neoclassical economists see a value in...Ch. 26 - If aggregate supply is vertical, what role does...Ch. 26 - What is the shape of the neoclassical long-run...Ch. 26 - When the economy is experiencing a recession, why...Ch. 26 - If the economy is suffering through a rampant...Ch. 26 - If most people have rational expectations, how...Ch. 26 - Explain why the neoclassical economists believe...Ch. 26 - Economists from all theoretical persuasions...Ch. 26 - Is it a logical contradiction to be a neoclassical...Ch. 26 - Use Table 26.3 to answer the following questions....
Additional Business Textbook Solutions
Find more solutions based on key concepts
E2-13 Identifying increases and decreases in accounts and normal balances
Learning Objective 2
Insert the mis...
Horngren's Accounting (11th Edition)
Which one of the following would not be considered in the development of a partnership agreement? A. profit and...
Principles of Accounting Volume 1
Ravenna Candles recently purchased candleholders for resale in its shops. Which of the following costs would be...
Financial Accounting (12th Edition) (What's New in Accounting)
Discussion Questions 1. What characteristics of the product or manufacturing process would lead a company to us...
Managerial Accounting (4th Edition)
Steeler Towel Company estimates its overhead to be $250,000. It expects to have 100,000 direct labor hours cost...
Principles of Accounting Volume 2
Prepare a production cost report and journal entries (Learning Objectives 4 5) Vintage Accessories manufacture...
Managerial Accounting (5th Edition)
Knowledge Booster

Similar questions
- The following graph shows a decrease in aggregate demand (AD) in a hypothetical country. Specifically, aggregate demand shifts to the left from AD1AD1 to AD2AD2, causing the quantity of output demanded to fall at all price levels. For example, at a price level of 140, output is now $200 billion, where previously it was $300 billion. The following table lists several determinants of aggregate demand. Complete the table by indicating the change in each determinant necessary to decrease aggregate demand. Change needed to decrease AD Wealth (increase/ decrease) Taxes (increase/ decrease) Expected rate of return on investment (increase/ decrease) Incomes in other countries (increase/ decrease)arrow_forwardThe graph below is associated with a hypothetical country. Consider an increase in aggregate demand (AD). Specifically, aggregate demand shifts to the right from AD1AD1 to AD2AD2, causing the quantity of output demanded to rise at each price level. For instance, at a price level of 140, output is now $400 billion, where initially it was $300 billion. Fill in the missing values in the table by selecting the change in each scenario required to increase aggregate demand. Change required to increase AD Expected rate of return on investment. (decrease/increase) Incomes in other countries (decrease/increase) Consumer expectations about future profitability. (improve/worsen) Government spending (increase/decrease)arrow_forwardThe following graph shows an increase in aggregate demand (AD) in a hypothetical country. Specifically, aggregate demand shifts to the right from AD1 to AD2, causing the quantity of output demanded to rise at all price levels. For example, at a price level of 140, output is now $400 billion, where previously it was $300 billion. 170 160 150 140 - 130 AD2 120 110 AD, 100 90 100 200 300 400 500 600 700 800 OUTPUT (Billions of dollars) The following table lists several determinants of aggregate demand. Complete the table by indicating the change in each determinant necessary to increase aggregate demand. Change Needed to Increase AD Wealth Taxes Interest rates The value of the domestic currency relative to the foreign currency PRICE LEVELarrow_forward
- The following graph shows an increase in aggregate supply (ASAS) in a hypothetical economy. Specifically, aggregate supply shifts to the right from AS1AS1 to AS2AS2, causing the quantity of output supplied at a price level of 125 to rise from $250 billion to $350 billion. The following table lists several determinants of aggregate supply. Complete the table by indicating the changes in the determinants necessary to increase aggregate supply. Determinant Change Needed to Increase ASAS Nominal Wage Rate Tax Rates Technologyarrow_forwardDraw an aggregate demand and supply diagram for Japan. In the diagram, show how each of the following affects aggregate demand and supply: The U.S. gross domestic product falls. The level of prices in Korea falls. Labor receives a large wage increase. Economists predict higher prices next year.arrow_forwardThe aggregate demand curve portrays the relationship between price level and real GDP. What are the three reasons this relationship is a negative or inverse relationship? Provide brief illustrations of each.arrow_forward
- "The demand curves for all products have negative slopes. For instance, the demand curves for milk,automobiles, personal computers, and shirts all have negative slopes. Therefore, because the aggregate demand curve shows the demand for all products, it too must have a negative slope. " Comment on this assertion.arrow_forwardEvaluate the following statements using relevant diagrams and provide detailedexplanations. The statements describe events that might shift aggregate demand (AD),aggregate supply (AS), both or neither. Clearly label your diagrams. A) A recent economic report suggests that consumer confidence has increased.B) Apple Inc. has announced a 50% discount on its new generation iPad devices foruniversity students.C) After a prolonged acceleration in economic activity, the government raises the rateof personal income tax.D) A continuing economic expansion has drawn in many working age people (andtheir families) from neighbouring countries in search of jobs and better lives.arrow_forwardDescribe the change in aggregate supply that should result from each of the following changes in determinants. Assume that nothing else is changing besides the identified change. (In your answer, indicate whether the change will "Decrease" or "Increase" aggregate supply or have no effect.) (a) A rise in the average price of inputs; (b) An increase in worker productivity; (c) Government antipollution regulations become stricter; (d) A new subsidy program is enacted for new business investment in productive equipment; (e) Energy prices decline.arrow_forward
- Evaluate the following statements using relevant diagrams and provide detailed explanations. The statements describe events that might shift aggregate demand (AD), aggregate supply (AS), both or neither. Clearly label your diagrams. A recent economic report suggests that consumer confidence has increased Apple Inc. has announced a 50% discount on its new generation iPad devices for university students After a prolonged acceleration in economic activity, the government raises the rate of personal income tax. A continuing economic expansion has drawn in many working age people (and their families)from neighbouring countries in search of jobs and better livesarrow_forwardAs you know, supply and demand shifts are caused by one of their determinants. Shifts in aggregate demand (AD) show the effect of events on price level and Real GDP. Any event that causes a change in consumer, business, or government spending or any change in net exports (C+l+G+Xn) will shift AD. Any event that causes a change in production costs or increases productivity will shift aggregate supply (AS). Decide if the following events are Micro, shifting supply or demand, or Macro, shifting AD or AS. Give the direction in which the graph shifts. Demand Situation Aggregate Supply Aggregate Demand Supply Sales of Atlanta Braves gear grows with the success of the team. 1. The President and Congress pass a trillion dollar stimulus bill to provide aid during recession. 2. 3. Salmonella outbreak in peanut processing plants threatens lunches for school children. 4. Pomegranates are shown to be cancer fighting superfoods. Value of U.S. dollars declines, exports increase. 5. Global oil prices…arrow_forwardSuppose that the price index of 150 for quantity demanded of US Real GDP is 10.0 trillion worth of goods. Do these data represent aggregate demand or a point on an aggregate demand curve? Explain your answer.arrow_forward
arrow_back_ios
SEE MORE QUESTIONS
arrow_forward_ios
Recommended textbooks for you

 Economics (MindTap Course List)EconomicsISBN:9781337617383Author:Roger A. ArnoldPublisher:Cengage Learning
Economics (MindTap Course List)
Economics
ISBN:9781337617383
Author:Roger A. Arnold
Publisher:Cengage Learning