a)
To determine: Earnings per share.
a)
Explanation of Solution
Calculation of EPS:
Hence, Earnings per share (EPS) is $4.20
b)
To determine: Price-to-earnings ratio.
b)
Explanation of Solution
Calculation of price-to-earnings ratio:
Hence, price earnings ratio is $7.6.
c)
To determine: Book value per share.
c)
Explanation of Solution
Calculation of book value per share:
Hence, book value per share is $16
d)
To determine: Market-to-book ratio.
d)
Explanation of Solution
Calculation of market-to-book ratio:
Hence, book value per share is $16
e)
To determine: EV-EBITDA multiple.
e)
Explanation of Solution
Calculation of EV-EBITDA multiple:
EV is nothing but the enterprise value
Calculation of enterprise value:
Hence, enterprise value is $230 million
Calculation of EBITDA:
Hence, EBITDA is $50 million
Calculation of EV-EBITDA multiple:
Hence, EV-EBITDA multiple is 4.6 times
f)
To determine: Addition to
f)
Explanation of Solution
Calculation of additions to retained earnings:
Hence, additions to retained earnings are $11million.
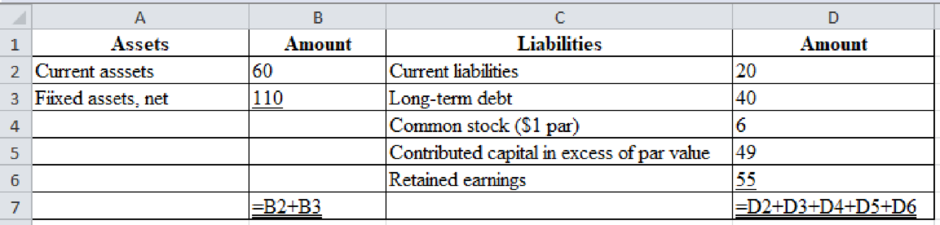
g)
To construct: New balance sheet of Company E.
g)
Explanation of Solution
Excel spreadsheet:
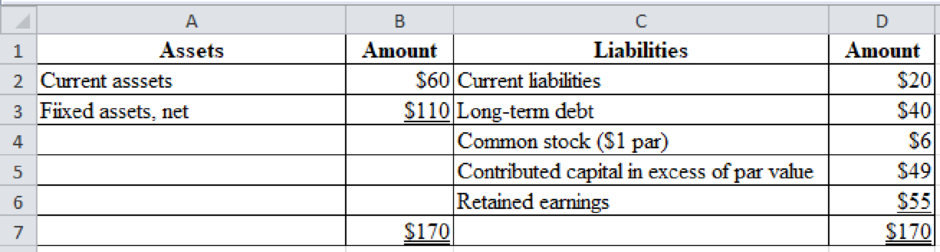
Excel workings:
Want to see more full solutions like this?
Chapter 3 Solutions
EBK CONTEMPORARY FINANCIAL MANAGEMENT

- Define each of the following terms: Liquidity ratios: current ratio; quick, or acid test, ratio Asset management ratios: inventory turnover ratio; days sales outstanding (DSO); fixed assets turnover ratio; total assets turnover ratio Financial leverage ratios: debt ratio; times-interest-earned (TIE) ratio; EBITDA coverage ratio Profitability ratios: profit margin on sales; basic earning power (BEP) ratio; return on total assets (ROA); return on common equity (ROE) Market value ratios: price/earnings (P/E) ratio; price/cash flow ratio; market/book (M/B) ratio; book value per share Trend analysis; comparative ratio analysis; benchmarking DuPont equation; window dressing; seasonal effects on ratiosarrow_forwardThe balance sheet and income statement for the J. P. Robard Mfg. Company are as follows: Calculate the following ratios: Current ratio Times interest earned Inventory turnover Total asset turnover Operating profit margin Operating return on assets Debt ratio Average collection period Fixed asset turnover Return on equity J. P. Robard Mfg., Inc. Balance Sheet ($000) Cash $550 Accounts receivable 2,100 Inventories 1,060 Current assets $3,710 Net fixed assets 4,520 Total assets $8,230 Accounts payable $1,200 Accrued expenses 610 Short-term notes payable 280 Current liabilities $2,090 Long-term debt 2,000 Owners' equity 4,140 Total liabilities and owners' equity $8,230 J. P. Robard Mfg., Inc. Income Statement ($000) Net sales (all credit) $7,940 Cost of goods sold 3,310 Gross Profit $4,630 Operating expenses (includes $500 depreciation) 3,050 Net operating income $1,580 Interest expense 368 Earnings before taxes $1,212 Income taxes (40%) 485 Net income $727arrow_forwardCompute the following profitability ratios of the company for the most recent two years, show all values in the computations: 1.Asset Turnover 2.Profit margin ratio(Net Income/Net Sales) 3.Return on total assets (Net Income/Average Total Assets) 4.Return on stockholders’ equity 5.Basic Earnings per share (EPS) Based on the results above, what conclusions can you make about the company’s overall profitability and efficient use of assets?arrow_forward
- Using the statements provided Calculate the following liquidity ratios: Current ratio Quick ratio Calculate the following asset management ratios: Average collection period Inventory turnover Fixed asset turnover Total asset turnover Calculate the following financial leverage ratios Debt to equity ratio Long-term debt to equity Calculate the following profitability ratios: Gross profit margin Net profit margin Return on assets Return on stockholders’ equity For example: you should present it like the text, or as:Gross margin = 1,933 divided by 8,689 = 22.2% A competitor of ACME has for the same time period reported the following three ratios: Current ratio 1.52Long-term debt to equity .25 or 25%Net profit margin .08 or 8% Given these three ratios only which company is performing better on each ratio? Also overall who would you say has the best financial performance and position. Support your answer.arrow_forwardComparative balance sheets report average total assets for the year of $2,450,000 and average totalequity of $1,825,000 (dollar amounts in thousands, except earnings per share).a. Prepare an income statement for the year in a multiple-step format.b. Compute the ( 1 ) gross profit rate, ( 2 ) net income as a percentage of net sales, ( 3 ) return onassets, and ( 4 ) return on equity for the year. (Round computations to the nearest one-tenth of1 percent.)c. Explain why interest revenue is not included in the company’s gross profit computationarrow_forwardBelow are the two basic financial statements of Chiz Trading Company. You are tasked to prepare an analysis using Horizontal and Vertical Analysis of their two-dated financial statements. In addition to this you have been tasked to prepare financial ratios measuring the company’s: Liquidity Status Current Ratios Quick Asset Ratios Efficiency Status Asset Turnover Fixed Asset Turnover Inventory Turnover Days in Inventory Accounts Receivable Turnover Days in Receivable Profitability Status: Gross Profit margin Ratio Operating Income Ratio Net Profit Ratio Return on Assets Return on Equityarrow_forward
- Following are the financial statements of AB Ltd. for 2010. From the aforementioned table, calculate the following: Current ratio Liquid ratio Receivables turnover ratio and collection period Inventory turnover and holding period Fixed assets turnover Total assets turnover Debt ratio D/E ratio Interest coverage ratio PAT margin ROA ROE EPS D/P ratio P/E ratio Book value per sharearrow_forwardUse the information in the table below to calculate the following ratios for Windswept Woodworks for year 1 and year 2. Windswept Woodworks, Incorporated Input Data (millions of dollars) Accounts payable Accounts receivable Accumulated depreciation Cash & equivalents. Common stock Cost of goods sold Depreciation expense Common stock dividends paid. Interest expense Inventory Addition to retained earnings. Long-term debt. Notes payable Gross plant & equipment Retained earnings. Sales Other current liabilities Tax rate Year 2 interest coverage ratio Year 1 interest coverage ratio Year 2 ACP Year 1 ACP c. Current ratio Year 2 current ratio Year 1 current ratio d. Quick ratio Year 2 622 1,466 6,932 410 Year 2 quick ratio Year 1 quick ratio 1,370 1,590 days days ? ? 230 1,200 602 998 320 10,620 3,248 3,108 Market price per share-year end Number of shares outstanding (For all requirements, round your answers to 2 decimal places.) Required: a. Interest coverage ratio (Assume that year 1 EBIT…arrow_forward(This is what is in between the 1st and 2nd screenshot) Using these data, determine the following: Earnings per share. Round your answer to two decimal places. Price-to-earnings ratio. Round your answer to two decimal places. Book value per share. Round your answer to two decimal places. Market-to-book ratio. Round your answer to two decimal places. EV-EBITDA multiple. Assume the cost of sales includes $14 million in depreciation expenses. Assume there are no amortization expenses. Round your answer to two decimal places. How much of the retained earnings total was added during Year 1? Enter your answer in millions. For example, an answer of $1.2 million should be entered as 1.2, not 1,200,000. Round your answer to two decimal places.$ million Show Eastland’s new balance sheet after the company sells 1 million new common shares in early Year 2 to net $28 a share. Part of the proceeds, $12 million, is used to reduce current liabilities, and the remainder is temporarily…arrow_forward
- 2. Financial statements for Skyline Inc. and industry average financial ratios are shown below. Current Assets Cash A/R Inventories Total CA Net fixed assets Net plant and equipment Total Assets Sales COGS Net income EBIT (Opering income) Interest expense EBT (Taxable income) Taxes (40%) Ratio Current ratio Assets Days sales outstanding Inventory turnover Gross profit Fixed operating expenses except depreciation Earnings before interest, taxes, depre and amort (EBITDA) Depreciation Total assets turnover Net profit margin a. Calculate the indicated ratios for Skyline. Return on assets (ROA) Equity multiplier Return on equity (ROE) Debt ratio Balance Sheet as of Dec 31 Skyline 2021 Industry 75,500 330,000 300,500 706,000 315,500 Income Statement for the year ending Dec 31 1,021,500 Current Liabilities Accts payable Notes payable Other current liabilities Total CL Long-term debt Total Liabilities Common Equity Total Liabilities and Equity Liabilities and Owner's Equity DuPont ROA 2021…arrow_forwardReturn on total assets; a company reports the following income statement and balance sheet information for the current year: net income $178,320 interest expense $31,470 average total assets $3,330,000. A. Determine the return of total assets. B. Determine the company's price- earnings ratio.arrow_forwardUsing the Balance Sheets and Income Statement below, please calculate the following ratios for Smolira Golf Corp. (use year-end figures rather than average values where appropriate): Short-term solvency ratios Current Ratio Quick Ratio Cash Ratio Asset utilization ratios: Total asset turnover Inventory turnover Receivables turnover Long-term solvency ratios: Total debt ratio Debt-equity ratio Equity multiplier Times interest earned ratio Cash coverage ratio Profitability ratios: Profit Margin Return on Assets Return on Equity We will follow up and discuss your calculations during this week's live session. SMOLIRA GOLD CORP.2014 and 2015 Balance Sheets Assets ($) Liabilities and Owners' Equity ($) 2014 2015 2014 2015 Current Assets Current Liabilities Cash 26,450 29,106 Accounts Payable 30,602 35,485 Accounts Receivable 13,693 18,282 Notes Payable 15,840 13,500 Inventory 27,931 32,586…arrow_forward
 EBK CONTEMPORARY FINANCIAL MANAGEMENTFinanceISBN:9781337514835Author:MOYERPublisher:CENGAGE LEARNING - CONSIGNMENT
 Intermediate Financial Management (MindTap Course...FinanceISBN:9781337395083Author:Eugene F. Brigham, Phillip R. DavesPublisher:Cengage Learning
 Cornerstones of Financial AccountingAccountingISBN:9781337690881Author:Jay Rich, Jeff JonesPublisher:Cengage Learning
 Managerial Accounting: The Cornerstone of Busines...AccountingISBN:9781337115773Author:Maryanne M. Mowen, Don R. Hansen, Dan L. HeitgerPublisher:Cengage Learning