
Videos
Open P2WORK4 and click the Chart sheet tab. On the screen, a pie chart shows the percentage composition of the total expenses of Sports Connection. Enter the percentages in the spaces provided.
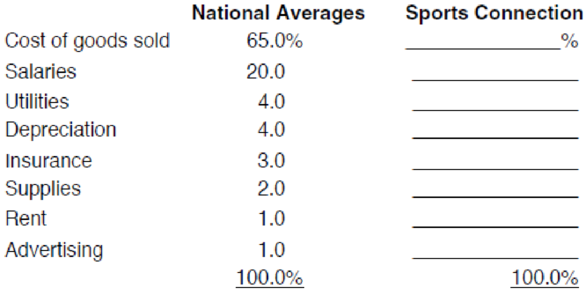
Compare the percentages of Sports Connection with the national statistics provided. Comment on the differences noted. Why might depreciation, utilities, and rent (as a group) be so far off from the national percentages? Any explanation for salaries? Cost of goods sold? When the assignment is complete, close the file without saving it again.
TICKLERS (optional)
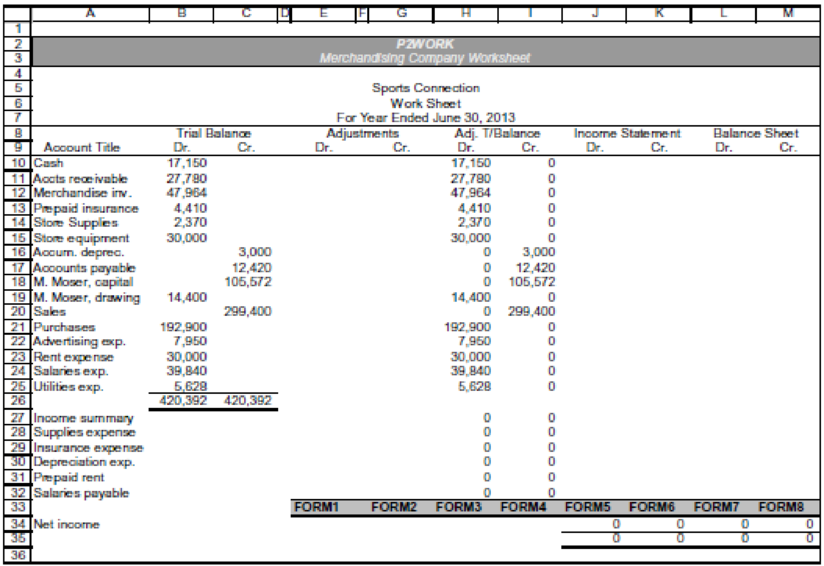
Worksheet. You prepared a
Chart. Using the P2WORK4 file, create a column chart showing the dollar total of each of the expenses (except Cost of goods sold) of Sports Connection. Use the Chart Data Table as a basis for preparing the chart. Use appropriate titles, legends, and formats. Enter your name somewhere on the chart. Save the file again as P2WORK4. Select the chart and then print it out.
Want to see the full answer?
Check out a sample textbook solution
Chapter 3 Solutions
Excel Applications for Accounting Principles


- Would you please describe the following accounts and tell me 1) What Financial Statement(s) they appear on 2) Are they DR or CR balance accounts1) Salary Expense (In addition to the questions above how is this different than Wages Expense?)2) Service Fee Revenue3) Sales Returns4)Interest Expense5) Acrrued Liabilities (In addition to above question can you provide and example of an accrued liability)6) Selling Expense (How is this different from Cost of Goods Sold?)arrow_forwardConsider the following accounts and identify each account as an Asset(A), Liability(L), or Equity(E). Thanks! taxes payable Rent Expesnes Furniture Nunez,Withdrwal Unearned revenuearrow_forwardWhat are revenues that have been earned but not recorded in the accounts called? Group of answer choices cost revenues matching revenues accrued revenues cash revenuesarrow_forward
- Identify which one of the following formula is used to calculate the net income of the service companies in an accounting period? a.Net Purchases – Cost of goods sold b.Net Sales – Cost of goods sold c.Services Revenue – Operational and Administrative Expenses d.Operational and Administrative Expenses – Service Revenuearrow_forwardDetermining the amount of prepaid expenses Consider the facts presented in the following table for Tropical View: Complete the table by filling in the missing values.arrow_forwardNeed help to answer the net income through the direct-write off method and the allowance method. Please show equations/calculations so I can see what to do. Thank you in advance :Darrow_forward
- a. What is your company’s primary revenue, secondary revenue, and gains? b. What is your company’s primary expenses, secondary expenses, financial activity generated expenses, and losses? c. What is the revenue trend? Does the 10-K or 10-Q discuss primary revenues, as well as other revenue types? d. What do the accounting policies say in the annual report (footnotes) regarding the cost of revenue? What are the drivers to the cost of revenue and the trends?arrow_forwardn: In a sheet of paper, write TRUE if the statement is correct and FALSE if the statement is incorrect. 1. The revenue earned by a service business for rendering services for a fee is commonly referred to as Service Income or Service Revenue. 2. A Statement of Comprehensive Income may be presented using a “multistep statement” presentation only. 3. Revenue includes both income and gains. 4. If expenses are greater than income, the difference is net loss. 5. The revenue earned by the merchandising business from its sales of goods is commonly referred to as Sales. 6. Income increases economic benefits during the period in the form of inflows of cash from rendering services. 7. The statement of Comprehensive Income shows information on an entity’s financial performance during the period. 8. A Statement of Comprehensive Income that shows expenses by its function is referred to as prepared using a single-step approach. 9. Expenses encompass both…arrow_forwardWhich of the following is operating expenses ? a) Administrative expenses ratio b) Selling and Distribution expenses ratio c) Factory expenses ratio d) Finance Expenses ratio Select one: a. a, b and c b. a, b and d c. a, c and d d. a, b, c, darrow_forward
- Which of the following is a variables cost? A) rent B)loan interest rate C)salesperson’s commissioner D)salaryarrow_forwardI thought for an Income Statement you only need serivce revenue, subract expenses and then you get a total which is the net income?arrow_forwardIn the eBook, NetSolutions calls their revenue earned from providing services __________________. (Some service companies call it service revenue, but it means the same thing.) Group of answer choices cost revenue. sales. interest earned. fees earned.arrow_forward
 Excel Applications for Accounting PrinciplesAccountingISBN:9781111581565Author:Gaylord N. SmithPublisher:Cengage Learning