Foundations of Financial Management
16th Edition
ISBN: 9781259277160
Author: Stanley B. Block, Geoffrey A. Hirt, Bartley Danielsen
Publisher: McGraw-Hill Education
expand_more
expand_more
format_list_bulleted
Videos
Textbook Question
Chapter 3, Problem 7P
The Haines Corp. shows the following financial data for 20X1 and 20X2:
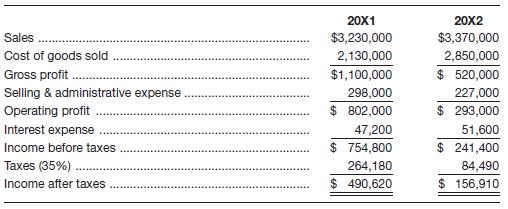
For each year, compute the following and indicate whether it is increasing or decreasing profitability in 20X2 as indicated by the ratio:
a. Cost of goods sold to sales.
b. Selling and administrative expense to sales.
c. Interest expenses to sales.
Expert Solution & Answer
Want to see the full answer?
Check out a sample textbook solution
Students have asked these similar questions
Find in Amount ($) and Percentage(%) for Year 2 over Year 1:
Income Statement -
(a) Sales Revenue
(b) Cost of sales
(c) Gross Margin
ABC Company reported the following data for the current year:
1. How much is the gross profit?
2. How much is the administrative expense?
3. How much is the selling expense?
4. How much is the net income?
Compute the following for year 2:
2-a. Percentage markup on sales. (Round percentage answer to 1 decimal place (i.e., 0.124 should be entered as 12.4)
2-b. Income tax rate. (Round percentage answer to 1 decimal place (i.e., 0.124 should be entered as 12.4).)
2-c. Net profit margin ratio. Was it a good or poor indicator of performance? (Round percentage answer to 2 decimal places (i.e., 0.1243 should be entered as 12.43).)
2-d. Percentage of total resources invested in property, plant, and equipment. (Round percentage answer to 2 decimal places (i.e., 0.1243 should be entered as 12.43).)
2-e. Debt-to-equity ratio. Interpret the result. (Round the final answer to 2 decimal places.)
2-f. Return on assets. Assume that long-term debt increased to $36,810 in month 1 of year 2. (Round intermediate calculations to 3 decimal places and percentage answer to 2 decimal places (i.e., 0.1243 should be entered as 12.43).)
2-g. Return on equity. (Round percentage answer to 2 decimal places (i.e.,…
Chapter 3 Solutions
Foundations of Financial Management
Ch. 3 - If we divide users of ratios into short-term...Ch. 3 - Explain how the Du Pont system of analysis breaks...Ch. 3 - If the accounts receivable turnover ratio is...Ch. 3 - Prob. 4DQCh. 3 - Is there any validity in rule-of-thumb ratios for...Ch. 3 - Why is trend analysis helpful in analyzing ratios?...Ch. 3 - Inflation can have significant effects on income...Ch. 3 - What effect will disinflation following a highly...Ch. 3 - Why might disinflation prove favorable to...Ch. 3 - Comparisons of income can be very difficult for...
Ch. 3 - Low Carb Diet Supplement Inc. has two divisions....Ch. 3 - Database Systems is considering expansion into a...Ch. 3 - Prob. 3PCh. 3 - Prob. 4PCh. 3 - Prob. 5PCh. 3 - Dr. Zhivà€go Diagnostics Corp.’s income...Ch. 3 - The Haines Corp. shows the following financial...Ch. 3 - Easter Egg and Poultry Company has $2,000,000 in...Ch. 3 - Prob. 9PCh. 3 - Prob. 10PCh. 3 - Baker Oats had an asset turnover of 1.6 times per...Ch. 3 - AllState Trucking Co. has the following ratios...Ch. 3 - Front Beam Lighting Company has the following...Ch. 3 - Prob. 14PCh. 3 - Prob. 15PCh. 3 - Jerry Rice and Grain Stores has $4,780,000 in...Ch. 3 - Prob. 17PCh. 3 - Prob. 18PCh. 3 - Prob. 19PCh. 3 - Prob. 20PCh. 3 - Jim Short’s Company makes clothing for schools....Ch. 3 - The balance sheet for Stud Clothiers is shown...Ch. 3 - The Lancaster Corporation’s income statement is...Ch. 3 - Prob. 24PCh. 3 - Prob. 25PCh. 3 - Prob. 26PCh. 3 - Prob. 27PCh. 3 - Prob. 28PCh. 3 - The Global Products Corporation has three...Ch. 3 - Prob. 30PCh. 3 - Prob. 31PCh. 3 - Prob. 32PCh. 3 - Prob. 33PCh. 3 - Prob. 34PCh. 3 - The following information is from Harrelson...Ch. 3 - Using the financial statements for the Snider...Ch. 3 - Given the financial statements for Jones...
Knowledge Booster


Learn more about
Need a deep-dive on the concept behind this application? Look no further. Learn more about this topic, finance and related others by exploring similar questions and additional content below.Similar questions
- Juroe Company provided the following income statement for last year: Juroes balance sheet as of December 31 last year showed total liabilities of 10,250,000, total equity of 6,150,000, and total assets of 16,400,000. Required: 1. Calculate the return on sales. (Note: Round the percent to two decimal places.) 2. CONCEPTUAL CONNECTION Briefly explain the meaning of the return on sales ratio, and comment on whether Juroes return on sales ratio appears appropriate.arrow_forwardSundahl Companys income statements for the past 2 years are as follows: Refer to the information for Sundahl Company above. Required: 1. Prepare a common-size income statement for Year 1 by expressing each line item as a percentage of sales revenue. (Note: Round percentages to the nearest tenth of a percent.) 2. Prepare a common-size income statement for Year 2 by expressing each line item as a percentage of sales revenue. (Note: Round percentages to the nearest tenth of a percent.)arrow_forwardThe following is select account information for August Sundries. Sales: $850,360; Sales Returns and Allowances: $148,550; COGS: $300,840; Operating Expenses: $45,770; Sales Discounts: $231,820. If August Sundries uses a multi-step income statement format, what is their gross margin?arrow_forward
- Cuneo Companys income statements for the last 3 years are as follows: Refer to the information for Cuneo Company above. Required: 1. Prepare a common-size income statement for Year 1 by expressing each line item as a percentage of sales revenue. (Note: Round percentages to the nearest tenth of a percent.) 2. Prepare a common-size income statement for Year 2 by expressing each line item as a percentage of sales revenue. (Note: Round percentages to the nearest tenth of a percent.) 3. Prepare a common-size income statement for Year 3 by expressing each line item as a percentage of sales revenue. (Note: Round percentages to the nearest tenth of a percent.)arrow_forwardA condensed income statement for Weber Associates and a partially completed vertical analysis follow. Required: 1. Complete the vertical analysis by computing each missing line item as a percentage of net revenues. TIP: In the prior year, Cost of Goods Sold was 31 percent of Net Revenues, computed as ($1,397 ÷ $4,571). 2. Does Cost of Goods Sold, as a percentage of Net Revenues, represent better or worse performance in 2019 as compared to 2018? Complete this question by entering your answers in the tabs below. Required 1 Required 2 Complete the vertical analysis by computing each missing line item as a percentage of net revenues. TIP: In the prior year, Cost of Goods Sold was 31 percent of Net Revenues, computed as ($1,397 ÷ $4,571). (Decreases should be indicated by a minus sign. Round your answers to the nearest whole percent.) Net Revenues Cost of Goods Sold Research and Development Expense Sales and Marketing Expense General and Administrative Expense Income from Operations Other…arrow_forwardAlex is currently considering to invest his money in one of the companies betweenCompany A and Company B. The summarized final accounts of the companies for theirlast completed financial year are as follows: (refer to the images) Required:a. Calculate the following ratios for Company A and Company B. State clearly theformulae used for each ratio:i. Gross Profit Marginii. Net Profit Marginiii. Inventory Turnover Period (days)iv. Receivables Collection Period (days)v. Payables Payment Period (days)vi. Current Ratiovii. Quick Ratiob. Comment on each of the ratios calculated in part (a) above.arrow_forward
- 2) Ratios Based on the information given in picture #1, complete the following ratios for the last TWO years and indicate whether the trend is favorable or unfavorable. Note percentages and times should be to one decimal place (e.g. 14.8%; 5.8x) Profitability Ratios Current Yr. Prior Yr. Fav/Unfav. Gross Margin (%) {Gross Income/Sales Revenue} Profit Margin (%) {Net income/ Sales Revenue} Return on Assets (%) {Net Income/ Average Total Assets}arrow_forwardBarry's BBQ had sales revenue for the year of $400 million and net income of $30 million. Total assets were $50 million at the beginning of the year, and $60 million at the end of the year. Required: Calculate the following ratios: (Do not round intermediate calculations. Round your answers to one decimal place.) 1. Return on assets ratio 2. Profit margin ratio 3. Asset turnover ratio Return on assets Profit margin Asset turnover % timesarrow_forwardCOMPANY B Balance Sheets December 31, Year 2 and Year 1 Year 2 Year 1 Assets Current assets: Cash Accounts receivable Inventory Investments Long-term assets: Land $ 217,600 58,000 85,000 3,000 $ 110,000 82,000 70,000 1,000 380,000 690,000 (328,000) $1,105,600 380,000 570,000 (168,000) $1,045,000 Equipment Less: Accumulated depreciation Total assets Liabilities and Stockholders' Equity Current liabilities: Accounts payable Interest payable Income tax payable Long-term liabilities: Notes payable Stockholders' equity: Common stock Retained earnings $ 89,000 $4 5,000 7,000 75,000 11,000 4,000 120,000 240,000 600,000 284,600 $1,105,600 $1,045,000 600,000 115,000 Total liabilities and stockholders' equity Additional information for Year 2: 1. Net income is $169,600. 2. Sales on account are $1,183,000. 3. Cost of goods sold is $953,250. Required: 1. Calculate the following profitability ratios for Year 2: (Round vour answers to 1 decimal place.)arrow_forward
- Consider the following income statement data from the Ross Company: Current Year Prior Year $962,500 $720,000 582,960 440,820 182,175 156,420 104,100 79,000 13,533 8,532 Sales revenue Cost of goods sold Selling expenses Administrative expenses Income tax expense Prepare a comparative income statement, showing increases and decreases in dollars and in percentages. (Round percentages to one decimal.) Ross Company Comparative Income Statements Sales revenue Cost of goods sold Gross profit on sales Operating expenses Selling expenses Administrative expenses Total Income before income taxes Income tax expense Net income $ $ LA Current Year Prior Year (Decrease) $ $ Increase Percent Change $ LAarrow_forwardCompare Martinez and Rosado by converting their income statements to common size. Net sales.... Cost of goods sold. Other expense. Net income.. Which company earns more net income? Which company's net income is a higher percentage of its net sales? Net sales... Cost of goods sold. Other expenses. Net income.. $ $ $ $ Martinez Prepare the common-sized financial analysis: (Round percentages to the nearest tenth percent.) Martinez Amount 10,900 6,660 3,586 654 10,900 $ 6,660 3,586 % 654 $ % $ % % Rosado % $ 16,540 11,909 3,837 794 Rosado Amount 16,540 11,909 3,837 794 % do do % % % %arrow_forward(This is what is in between the 1st and 2nd screenshot) Using these data, determine the following: Earnings per share. Round your answer to two decimal places. Price-to-earnings ratio. Round your answer to two decimal places. Book value per share. Round your answer to two decimal places. Market-to-book ratio. Round your answer to two decimal places. EV-EBITDA multiple. Assume the cost of sales includes $14 million in depreciation expenses. Assume there are no amortization expenses. Round your answer to two decimal places. How much of the retained earnings total was added during Year 1? Enter your answer in millions. For example, an answer of $1.2 million should be entered as 1.2, not 1,200,000. Round your answer to two decimal places.$ million Show Eastland’s new balance sheet after the company sells 1 million new common shares in early Year 2 to net $28 a share. Part of the proceeds, $12 million, is used to reduce current liabilities, and the remainder is temporarily…arrow_forward
arrow_back_ios
SEE MORE QUESTIONS
arrow_forward_ios
Recommended textbooks for you
 Managerial Accounting: The Cornerstone of Busines...AccountingISBN:9781337115773Author:Maryanne M. Mowen, Don R. Hansen, Dan L. HeitgerPublisher:Cengage Learning
 Survey of Accounting (Accounting I)AccountingISBN:9781305961883Author:Carl WarrenPublisher:Cengage Learning
 Principles of Accounting Volume 1AccountingISBN:9781947172685Author:OpenStaxPublisher:OpenStax College
Managerial Accounting: The Cornerstone of Busines...
Accounting
ISBN:9781337115773
Author:Maryanne M. Mowen, Don R. Hansen, Dan L. Heitger
Publisher:Cengage Learning
Survey of Accounting (Accounting I)
Accounting
ISBN:9781305961883
Author:Carl Warren
Publisher:Cengage Learning
Principles of Accounting Volume 1
Accounting
ISBN:9781947172685
Author:OpenStax
Publisher:OpenStax College
Financial ratio analysis; Author: The Finance Storyteller;https://www.youtube.com/watch?v=MTq7HuvoGck;License: Standard Youtube License