
Concept explainers
Videos
a.
Find the population standard deviation for each type of investment.
Find the riskiest and least risky investments.
a.
Answer to Problem 38E
- The standard deviation for Stocks, bills and bonds are 15.821, 1.99, and 9.35 respectively.
- The risk is highest for stock investment and the risk is lowest for bill investment.
Explanation of Solution
Calculation:
The annual percentage returns for the years 1993-2012, for the three categories of investments, stock, Treasure bills and Treasure bonds are given. The measure of risk of the investment can be expressed by standard deviation.
Standard deviation:
Let
Finding mean:
Software procedure:
Step-by-step procedure to find mean using the MINITAB software:
- Choose Stat > Basic Statistics > Display Descriptive Statistics.
- In Variables enter the columns Stocks, Bills, Bonds.
- Choose option statistics, and select N total, Mean.
- Click OK.
Output using the MINITAB software is given below:
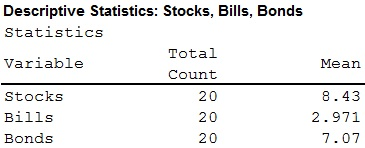
- From the MINITAB output the mean of Stocks, Bills and Bonds are 8.43, 2.971 and 7.07 respectively.
Standard deviation for Stocks:
The deviation, deviation’s squares are calculated below:
| x | ||
| 13.72 | 5.29 | 27.9841 |
| 2.14 | –6.29 | 39.5641 |
| 33.45 | 25.02 | 626.0004 |
| 26.01 | 17.58 | 309.0564 |
| 22.64 | 14.21 | 201.9241 |
| 16.1 | 7.67 | 58.8289 |
| 25.22 | 16.79 | 281.9041 |
| –6.18 | –14.61 | 213.4521 |
| –7.1 | –15.53 | 241.1809 |
| –16.76 | –25.19 | 634.5361 |
| 25.32 | 16.89 | 285.2721 |
| 3.15 | –5.28 | 27.8784 |
| –0.61 | –9.04 | 81.7216 |
| 16.29 | 7.86 | 61.7796 |
| 6.43 | –2 | 4 |
| –33.84 | –42.27 | 1,786.753 |
| 18.82 | 10.39 | 107.9521 |
| 11.02 | 2.59 | 6.7081 |
| 5.53 | –2.9 | 8.41 |
| 7.26 | –1.17 | 1.3689 |
| Total |
Substitute
Thus, the standard deviation for stocks is 15.821.
Standard deviation for Bills:
The deviation, deviation’s squares are calculated below:
| x | ||
| 2.98 | 0.009 | 0.0001 |
| 3.99 | 1.019 | 1.0384 |
| 5.52 | 2.549 | 6.4974 |
| 5.02 | 2.049 | 4.1984 |
| 5.05 | 2.079 | 4.3222 |
| 4.73 | 1.759 | 3.0941 |
| 4.51 | 1.539 | 2.3685 |
| 5.76 | 2.789 | 7.7785 |
| 3.67 | 0.699 | 0.4886 |
| 1.66 | –1.311 | 1.7187 |
| 1.03 | –1.941 | 3.7675 |
| 1.23 | –1.741 | 3.0311 |
| 3.01 | 0.039 | 0.0015 |
| 4.68 | 1.709 | 2.9207 |
| 4.64 | 1.669 | 2.7856 |
| 1.59 | –1.381 | 1.9072 |
| 0.14 | –2.831 | 8.0146 |
| 0.13 | –2.841 | 8.0713 |
| 0.03 | –2.941 | 8.6495 |
| 0.05 | –2.921 | 8.5322 |
| Total |
Substitute
Thus, the standard deviation for stocks is 1.99.
Standard deviation for Bonds:
The deviation, deviation’s squares are calculated below:
| x | ||
| 14.21 | 7.14 | 50.9796 |
| –8.04 | –15.11 | 228.3121 |
| 23.48 | 16.41 | 269.2881 |
| 1.43 | –5.64 | 31.8096 |
| 9.94 | 2.87 | 8.2369 |
| 14.92 | 7.85 | 61.6225 |
| –8.25 | –15.32 | 234.7024 |
| 16.66 | 9.59 | 91.9681 |
| 5.57 | –1.5 | 2.2500 |
| 15.12 | 8.05 | 64.8025 |
| 0.38 | –6.69 | 44.7561 |
| 4.49 | –2.58 | 6.6564 |
| 2.87 | –4.2 | 17.6400 |
| 1.96 | –5.11 | 26.1121 |
| 10.21 | 3.14 | 9.8596 |
| 20.1 | 13.03 | 169.7809 |
| –11.12 | –18.19 | 330.8761 |
| 8.46 | 1.39 | 1.9321 |
| 16.04 | 8.97 | 80.4609 |
| 2.97 | –4.1 | 16.8100 |
| Total |
Substitute
Thus, the standard deviation for bonds is 9.35.
- Hence, the standard deviation for Stocks, bills and bonds are 15.821, 1.99 9.35 respectively.
- If the standard deviation is high, the risk is also higher.
- Here, the standard deviation for Stocks is highest, therefore the risk is also highest in stock investment.
- The standard deviation for bills is lowest, therefore the risk is also lowest in bill investment.
b.
Explain whether the result is same as the theory or not.
b.
Answer to Problem 38E
The result is same as the theory.
Explanation of Solution
It is given that the long term loans are riskier than short-term loans. The treasure bills are short term loans and the treasure bonds are long term loans.
- From part (a), the standard deviation for Stocks, bills and bonds are 15.821, 1.99 9.35 respectively.
It is known that the higher standard deviation implies the higher risk.
The standard deviation for the treasure bonds (long term) is more than the standard deviation for the treasure bills (short-term). That is,
Therefore, long term loans are riskier than short-term loans.
Hence, the result is same as the theory.
c.
Find the mean return for each class of the investment.
c.
Answer to Problem 38E
The result follows the theory.
Explanation of Solution
- It is given that if any investment has more risk the mean return will also be more.
- From part (a), the mean of Stocks, Bills and Bonds are 8.43, 2.971 and 7.07 respectively.
The mean for the treasure bonds (long term) is more than the mean for the treasure bills (short-term). That is,
Therefore, long term loans has more mean.
Hence, the result follows the theory.
Want to see more full solutions like this?
Chapter 3 Solutions
Essential Statistics


 MATLAB: An Introduction with ApplicationsStatisticsISBN:9781119256830Author:Amos GilatPublisher:John Wiley & Sons Inc
 Probability and Statistics for Engineering and th...StatisticsISBN:9781305251809Author:Jay L. DevorePublisher:Cengage Learning
 Statistics for The Behavioral Sciences (MindTap C...StatisticsISBN:9781305504912Author:Frederick J Gravetter, Larry B. WallnauPublisher:Cengage Learning
 Elementary Statistics: Picturing the World (7th E...StatisticsISBN:9780134683416Author:Ron Larson, Betsy FarberPublisher:PEARSON
 The Basic Practice of StatisticsStatisticsISBN:9781319042578Author:David S. Moore, William I. Notz, Michael A. FlignerPublisher:W. H. Freeman
 Introduction to the Practice of StatisticsStatisticsISBN:9781319013387Author:David S. Moore, George P. McCabe, Bruce A. CraigPublisher:W. H. Freeman