
Determinants of demand and it relevance to the equilibrium position.
Explanation of Solution
Transaction demand for money is the need for money to meet the day-to-day expenditures. It varies directly with nominal
Asset demand for money refers to the desire of public to hold money in the form of financial assets, such as stocks, bonds and so forth. If the interest rate is greater, then people would be interested to save more thereby the asset demand for money would be lower and vice versa. Thus interest rate is the major determinant of the asset demand for money.
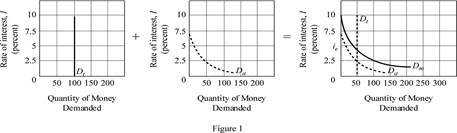
In figure -1, the horizontal axis measures quantity demanded and vertical axis measures the interest rate. The transaction demand for money, represented as Dt, is dependent only on the nominal GDP and has little effect by interest rate, so graphically it is depicted by a vertical line.
The asset demand for money, represented as Da in the figure has an inverse relation with the interest rate since it involves in the
The Total Money demand is the sum of Transaction demand and Asset demand for money
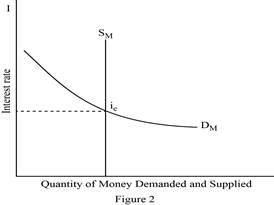
Figure- 2 depicts the equilibrium market, with quantity demanded and supplied measured in the horizontal axis and interest rate in the vertical axis.
The Monetary Authority (usually, the Central Bank of a country) decides on the Money Supply which is unaffected by the decisions that holds money for transaction or as financial asset. The Money Supply (Sm) is depicted by a vertical straight line which is independent of the rate of interest.
The Total Money demand (Dm) depends on the level of income and interest rate. It can be depicted as a linear function of income and interest rate. Demand for money varies directly with levels of income and inversely with the interest rate and slopes downward.
Dm = aY – bi
A
Dm = Sm
The interest rate at which equilibrium is made is the equilibrium interest rate (ie). Thus ie is determined at the point where Dm =Sm.
Let’s now illustrate the effect on equilibrium interest rate due to an increase in the total demand for money.
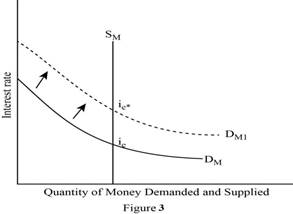
In Figure -3, the horizontal axis measures the quantity of money demanded and supplied and vertical axis represents the interest rate. When the Total money demand increases (shifts to right from DM to DM1) with money supply (SM) remaining constant, the equilibrium interest rate goes up from ie to ie*.
As the money demand increases, the previous interest rate is no longer sustainable because when the demand for money increases it exceeds the supply of money at the previous interest rate. This limits the money available to borrowers or creditors. Also there would be an upward pressure on the interest rate. Thus previous interest rate is no longer maintainable.
Concept Introduction:
Transaction demand for money: It refers to that amount of money required by individuals or firms to finance their current transaction or forthcoming expenditure.
Asset demand for money: It is the extent to which, people hold money in the form of asset.
Total Money demand: It refers to the desire of individuals or firms to hold money in the form of both financial assets and for transactions at each possible interest rate.
Equilibrium Interest rate: It is the point in which demand for money equals with the supply of money.
Want to see more full solutions like this?
Chapter 36 Solutions
Economics (Irwin Economics)

- According to your graph, the equilibrium value of money is , therefore the equilibrium price level is Now, suppose that the Fed reduces the money supply from the initial level of $3.5 billion to $2 billion. In order to reduce the money supply, the Fed can use open market operations to the public. Use the purple line (diamond symbol) to plot the new money supply (MS2 ). Immediately after the Fed changes the money supply from its initial equilibrium level, the quantity of money supplied is than the quantity of money demanded at the initial equilibrium. This contraction in the money supply will people's demand for goods and services. In the long run, since the economy's ability to produce goods and services has not changed, the prices of goods and services will and the value of money willarrow_forwardThe following table shows a money demand schedule, which is the quantity of money demanded at various price levels (P). Fill in the Value of Money column in the following table. Quantity of Money Demanded Price Level (P) Value of Money (1/P) (Billions of dollars) 1.00 1.5 1.33 2.0 2.00 3.5 4.00 7.0 Now consider the relationship between the price level and the quantity of money that people demand. The lower the price level, the money the typical transaction requires, and the money people will wish to hold in the form of currency or demand deposits. Assume that the Fed initially fixes the quantity of money supplied at $3.5 billion. Use the orange line (square symbol) to plot the initial money supply (MS1 ) set by the Fed. Then, referring to the previous table, use the blue connected points (circle symbol) to graph the money demand curve.arrow_forward2. Money supply, money demand, and adjustment to monetary equilibrium The following table gives the quantity of money demanded at various price levels (P), the money demand schedule. In the following table, fill in the column labeled Value of Money. Quantity of Money Demanded Price Level (P) Value of Money (1/P) (Billions of dollars) 1.00 1.00 1.33 0.75 2.00 0.50 4.00 0.25 1.5 2.0 3.5 7.0 Now consider the relationship between the quantity of money that people demand and the price level. The lower the price level, the less required to complete transactions, and the less money people will want to hold in the form of currency or demand deposits. Assume that the Federal Reserve initially fixes the quantity of money supplied at $3.5 billion. Use the orange line (square symbol) to plot the initial money supply (MS₁) set by the Fed. Then, referring to the previous table, use the blue connected points (circle symbol) to graph the money demand curve. moneyarrow_forward
- The following table shows a money demand schedule, which is the quantity of money demanded at various price levels (P). Fill in the Value of Money column in the following table. Quantity of Money Demanded Price Level (P) Value of Money (1/P) (Billions of dollars) 1.00 2.0 1.33 2.5 2.00 4.0 4.00 8.0 Now consider the relationship between the price level and the quantity of money that people demand. The lower the price level, the money the typical transaction requires, and the money people will wish to hold in the form of currency or demand deposits. Assume that the Fed initially fixes the quantity of money supplied at $4 billion.arrow_forwardThe following table gives the quantity of money demanded at various price levels (P), the money demand schedule. In the following table, fill in the column labeled Value of Money. Price Level (P) Value of Money (1/P) 0.80 1.00 1.33 2.00 Now consider the relationship between the quantity of money that people demand and the price level. The lower the price level, the required to complete transactions, and the money people will want to hold in the form of currency or demand deposits. VALUE OF MONEY Assume that the Federal Reserve initially fixes the quantity of money supplied at $4 billion. Use the orange line (square symbol) to plot the initial money supply (MS1) set by the Fed. Then, referring to the previous table, use the blue connected points (circle symbol) to graph the money demand curve. 2.00 1.75 1.50 1.25 1.00 0.75 0.50 0 0.25 Quantity of Money Demanded (Billions of dollars) 2.0 2.5 4.0 8.0 0 1 2 3 5 6 QUANTITY OF MONEY (Billions of dollars) 7 According to your graph, the…arrow_forwardSuppose the money market for some hypothetical economy is given by the following graph, which plots the money demand and money supply curves. Assume the central bank in this economy (the Fed) fixes the quantity of money supplied. Suppose the price level increases from 90 to 105. Shift the appropriate curve on the graph to show the impact of an increase in the overall price level on the market for money. Following the price level increase, the quantity of money demanded at the initial interest rate of 6% will be (greater/less)than the quantity of money supplied by the Fed at this interest rate. As a result, individuals will attempt to (increase/decrease) their money holdings. In order to do so, they will (buy/sell) bonds and other interest-bearing assets, and bond issuers will realize that they (have to offer higher/can offer lower) interest rates until equilibrium is restored in the money market at an interest rate of ______%. The following graph plots the…arrow_forward
- Homework Question 22: Hyperdeflation Can Be a Bit Cryptic to Understand Bitcoin is an electronic currency, which means that instead of having physical notes and coins, the currency only exists online. Bitcoins are unique in that there is no entity or individual that can increase the supply of Bitcoins. Instead Bitcoins are created by a computer algorithm that currently adds a fixed number of Bitcoins into circulation every hour, the algorithm is designed to gradually reduce the number of Bitcoins being produced, eventually reaching a growth rate of zero in 2040. You have been given the task of thinking about the potential for Bitcoin to become widely Only a small group of online vendors initially accepted Bitcoin but more and more are accepting it over time in other words the volume of goods and services that can be purchased with Bitcoin has been rising rapidly. a) Reformulate the Quantity Theory of Money to apply to Bitcoin, i.e define what M, P, V and Y are in the context of…arrow_forwardSuppose the money market for some hypothetical economy is given by the following graph, which plots the money demand and money supply curves. Assume the central bank in this economy (the Fed) fixes the quantity of money supplied. Suppose the price level decreases from 90 to 75. Shift the appropriate curve on the graph to show the impact of a decrease in the overall price level on the market for money. Following the price level decrease, the quantity of money demanded at the initial interest rate of 6% will be (greater/less) than the quantity of money supplied by the Fed at this interest rate. As a result, individuals will attempt to (increase/decrease) their money holdings. In order to do so, they will (buy/sell) bonds and other interest-bearing assets, and bond issuers will realize that they (have to offer higher/can offer lower) interest rates until equilibrium is restored in the money market at an interest rate of________% The following graph plots the…arrow_forwardWhen a consumer withdraws cash from a drawer in his house and deposits it in a savings account, the composition of the money supply immediately changes, and the size of the money supply may eventually alter as well. Demonstrate and explain how this activity may affect the money supply in an economy.arrow_forward
- Suppose the money market for some hypothetical economy is given by the following graph, which plots the money demand and money supply curves. Assume the central bank in this economy (the Fed) foxes the quantity of money supplied. Suppose the price level increases from 90 to 105. Shift the appropriate curve on the graph to show the impact of an increase in the overall price level on the market for money. ? INTEREST RATE (Percent) 2 10 Money Supply Morey Demand 60 10 MONEY (Billions of dollars) 100 120 Money Demand The following graph plots the aggregate demand curve for this economy. BT Money Supply Following the price level increase, the quantity of money demanded at the initial interest rate of 6% will be supplied by the Fed at this interest rate. As a result, individuals will attempt to bonds and other interest-bearing assets, and bond issuers will realize that they is restored in the money market at an interest rate of [ than the quantity of money their money holdings. In order to…arrow_forwardThe following table gives the quantity of money demanded at various price levels (P), the money demand schedule. In the following table, fill in the column labeled Value of Money. Price Level (P) Value of Money (1/P) 1.00 1.33 2.00 4.00 Quantity of Money Demanded (Billions of dollars) 2.0 2.5 4.0 8.0 Now consider the relationship between the quantity of money that people demand and the price level. The lower the price level, the required to complete transactions, and the money people will want to hold in the form of currency or demand deposits. 1.25 Assume that the Federal Reserve initially fixes the quantity of money supplied at $2.5 billion. Use the orange line (square symbol) to plot the initial money supply (MS₁) set by the Fed. Then, referring to the previous table, use the blue connected points (circle symbol) to graph the money demand curve. (?) moneyarrow_forwardThe following table gives the quantity of money demanded at various price levels (P), the money demand schedule. In the following table, fill in the column labeled Value of Money. Price Level (P) Value of Money (1/P) 0.80 1.00 1.33 2.00 Quantity of Money Demanded (Billions of dollars) 2.0 2.5 4.0 8.0 Now consider the relationship between the quantity of money that people demand and the price level. The lower the price level, the required to complete transactions, and the money people will want to hold in the form of currency or demand deposits. Assume that the Federal Reserve initially fixes the quantity of money supplied at $2.5 billion. money Use the orange line (square symbol) to plot the initial money supply (MS) set by the Fed. Then, referring to the previous table, use the blue connected points (circle symbol) to graph the money demand curve.arrow_forward


