
Essentials Of Business Analytics
1st Edition
ISBN: 9781285187273
Author: Camm, Jeff.
Publisher: Cengage Learning,
expand_more
expand_more
format_list_bulleted
Concept explainers
Videos
Textbook Question
Chapter 4, Problem 3P
Jensen Tire & Auto is deciding whether to purchase a maintenance contract for its new computer wheel alignment and balancing machine. Managers feel that maintenance expense should be related to usage, and they collected the following information on weekly usage (hours) and annual maintenance expense (in hundreds of dollars).
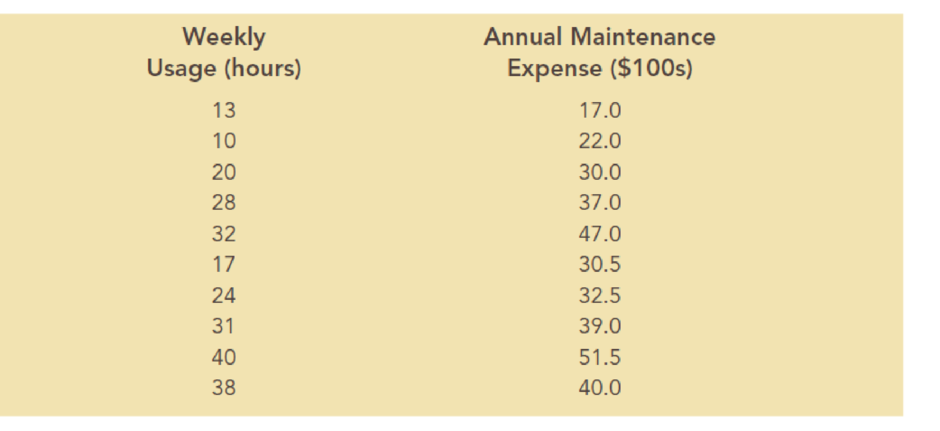
- a. Develop a scatter chart with weekly usage hours as the independent variable. What does the scatter chart indicate about the relationship between weekly usage and annual maintenance expense?
- b. Use the data to develop an estimated regression equation that could be used to predict the annual maintenance expense for a given number of hours of weekly usage. What is the estimated regression model?
- c. Test whether each of the regression parameters β0 and β1 is equal to zero at a 0.05 level of significance. What are the correct interpretations of the estimated regression parameters? Are these interpretations reasonable?
- d. How much of the variation in the sample values of annual maintenance expense does the model you estimated in part (b) explain?
- e. If the maintenance contract costs $3,000 per year, would you recommend purchasing it? Why or why not?
Expert Solution & Answer

Trending nowThis is a popular solution!

Students have asked these similar questions
Jensen Tire & Auto is deciding whether to purchase a maintenance contract for its newcomputer wheel alignment and balancing machine. Managers feel that maintenance expenseshould be related to usage, and they collected the following information on weeklyusage (hours) and annual maintenance expense (in hundreds of dollars).
a. Develop a scatter chart with weekly usage hours as the independent variable. Whatdoes the scatter chart indicate about the relationship between weekly usage and annualmaintenance expense?b. Use the data to develop an estimated regression equation that could be used to predictthe annual maintenance expense for a given number of hours of weekly usage. Whatis the estimated regression model?
c. Test whether each of the regression parameters b0 and b1 is equal to zero at a 0.05level of significance. What are the correct interpretations of the estimated regressionparameters? Are these interpretations reasonable?d. How much of the variation in the sample values of…
Which type of data source provides real-time data?
A. Historical data
B. Survey data
C. Transactional data
D. Social media data
Google has changed its strategy with regard to how much and over which media it invests in advertising. The following table shows Google's marketing budget in millions of dollars for 2008 and 2011 (The Wall Street Journal, March 27, 2012).
2008
2011
Internet
$26.0
$123.3
Newspaper, etc.
$4.0
$20.7
Television
$0.0
$69.3
a. Select a side-by-side bar chart with year as the variable on the horizontal axis.
Chapter 4 Solutions
Essentials Of Business Analytics
Ch. 4 - Bicycling World, a magazine devoted to cycling,...Ch. 4 - In a manufacturing process the assembly line speed...Ch. 4 - Jensen Tire Auto is deciding whether to purchase...Ch. 4 - A sociologist was hired by a large city hospital...Ch. 4 - The regional transit authority for a major...Ch. 4 - A marketing professor at Givens College is...Ch. 4 - The Dow Jones Industrial Average (DJIA) and the...Ch. 4 - The Toyota Camry is one of the best-selling cars...Ch. 4 - Dixie Showtime Movie Theaters, Inc., owns and...Ch. 4 - Prob. 10P
Ch. 4 - The American Association of Individual Investors...Ch. 4 - The National Football League (NFL) records a...Ch. 4 - Johnson Filtration. Inc., provides maintenance...Ch. 4 - A study investigated the relationship between...Ch. 4 - The U.S. Department of Energys Fuel Economy Guide...Ch. 4 - A highway department is studying the relationship...Ch. 4 - A sample containing years to maturity and...Ch. 4 - In 2011, home prices and mortgage rates fell so...Ch. 4 - A recent 10-year study conducted by a research...Ch. 4 - The Scholastic Aptitude Test (or SAT) is a...Ch. 4 - Consider again the example introduced in Section...Ch. 4 - Alumni donations are an important source of...
Knowledge Booster


Learn more about
Need a deep-dive on the concept behind this application? Look no further. Learn more about this topic, statistics and related others by exploring similar questions and additional content below.Similar questions
- In 2011 home prices and mortgage rates dropped so low that in a number of cities the monthly cost of owning a home was less expensive than renting. The following data show the average asking rent for 10 markets and the monthly mortgage on the median priced home (including taxes and insurance) for 10 cities where the average monthly mortgage payment was less than the average asking rent (The Wall Street Journal, November 26–27, 2011).Click on the datafile logo to reference the data. Enter negative values as negative numbers. a. Develop the estimated regression equation that can be used to predict the monthly mortgage given the average asking rent (to 2 decimals).The regression equation is:Mortgage ($) = + Rent ($)arrow_forwardAS2. NO10. DATA ANALYSISarrow_forwardDescribe how each of the following variables can be measured using the nominal, ordinal and ratio scale of measurements:a. Socio-economic statusb. Nutritional statusc. Anemia statusd. Educational attainmente. Distance of household from the nearest health centerarrow_forward
arrow_back_ios
arrow_forward_ios
Recommended textbooks for you
 Glencoe Algebra 1, Student Edition, 9780079039897...AlgebraISBN:9780079039897Author:CarterPublisher:McGraw Hill
 Holt Mcdougal Larson Pre-algebra: Student Edition...AlgebraISBN:9780547587776Author:HOLT MCDOUGALPublisher:HOLT MCDOUGAL
 College Algebra (MindTap Course List)AlgebraISBN:9781305652231Author:R. David Gustafson, Jeff HughesPublisher:Cengage Learning
 Functions and Change: A Modeling Approach to Coll...AlgebraISBN:9781337111348Author:Bruce Crauder, Benny Evans, Alan NoellPublisher:Cengage Learning
Glencoe Algebra 1, Student Edition, 9780079039897...
Algebra
ISBN:9780079039897
Author:Carter
Publisher:McGraw Hill
Holt Mcdougal Larson Pre-algebra: Student Edition...
Algebra
ISBN:9780547587776
Author:HOLT MCDOUGAL
Publisher:HOLT MCDOUGAL
College Algebra (MindTap Course List)
Algebra
ISBN:9781305652231
Author:R. David Gustafson, Jeff Hughes
Publisher:Cengage Learning
Functions and Change: A Modeling Approach to Coll...
Algebra
ISBN:9781337111348
Author:Bruce Crauder, Benny Evans, Alan Noell
Publisher:Cengage Learning
Correlation Vs Regression: Difference Between them with definition & Comparison Chart; Author: Key Differences;https://www.youtube.com/watch?v=Ou2QGSJVd0U;License: Standard YouTube License, CC-BY
Correlation and Regression: Concepts with Illustrative examples; Author: LEARN & APPLY : Lean and Six Sigma;https://www.youtube.com/watch?v=xTpHD5WLuoA;License: Standard YouTube License, CC-BY