Concept explainers
Videos
(a)
Introduction: Profit & loss statement is a statement which presents the revenues and expenses of the company in a structured way to reflect the net income/loss earned the company. Primarily, there are two methods of presenting the profit & loss statement i.e. condensed and detailed.
To construct: The base case projected P&L statement for radiologist group.
(a)
Answer to Problem 5.3P
Radiologist group’s net income is $62,500.
Explanation of Solution
Projected P&L statement for group is as follows:
| Particulars | Per procedure | Amount |
| Charge (revenue) for 7,500 patients | $ 100 | $ 750,000 |
| Less: Variable cost | $ 25 | $ 187,500 |
| Contribution | $ 75 | $ 562,500 |
| Less: Fixed cost | $ 500,000 | |
| Net income | $ 62,500 |
(b)
Introduction: Contribution margin can be computed by deducting variable cost from the sales value. Break-even point refers to a point where total expenses and total revenue of a company are equal. Break-even point can be described as a situation where there is no net profit or loss.
To find: Group’s contribution margin and breakeven point.
(b)
Answer to Problem 5.3P
Group’s contribution margin is $562,500 and breakeven point is$666,667.
Explanation of Solution
(c)
Sales volume at which group can earn a pre-tax profit of $100,000 and $200,000.
(c)
Answer to Problem 5.3P
- Sales volume to earn a profit level of $100,000 is $800,000.
- Sales volume to earn a profit level of $200,000 is $933,333.
Explanation of Solution
Desired sales volume to earn a profit level of $100,000
Desired sales volume to earn a profit level of $200,000
(d)
Sketch out CVP analysis graph depicting base situation.
(d)
Answer to Problem 5.3P
Breakeven point in CVP analysis graph is $666,667.
Explanation of Solution
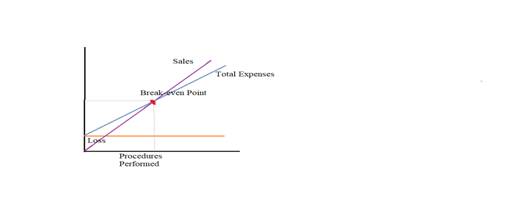
The graph above depicts the CVP analysis. The horizontal line depicts the fixed costs in the above diagram which is to be incurred irrespective of sales volumes. The intersection point of sales and total expenses on CVP graph is referred to as “Break-even point”.
(e)
Recalculate sub-parts (a) to (d) when 20% discount is given from charges (revenue).
(e)
Answer to Problem 5.3P
- Radiologist group’s net loss is $87,500.
- Group’s contribution margin is $412,500 and breakeven point is $727,273.
- Sales volume to earn a profit level of $100,000 is $872,727.
- Sales volume to earn a profit level of $200,000 is $1,018,182.
Explanation of Solution
(a) Radiologist group’s net income
| Particulars | Per procedure | Amount |
| Charge (revenue) for 7,500 patients | $ 80 | $ 600,000 |
| Less: Variable cost | $ 25 | $ 187,500 |
| Contribution | $ 55 | $ 412,500 |
| Less: Fixed cost | $ 500,000 | |
| Net loss | $ (87,500) |
(b) Group’s contribution margin and breakeven point
(c) Sales volume to earn a profit level of $100,000 and $200,000
(d) CVP analysis graph

The graph above depicts the CVP analysis. The horizontal line depicts the fixed costs in the above diagram which is to be incurred irrespective of sales volumes. The intersection point of sales and total expenses on CVP graph is referred to as “Break-even point”. Break-even point in the graph above is $727,273.
Want to see more full solutions like this?
Chapter 5 Solutions
EBK HEALTHCARE FINANCE: AN INTRODUCTION


- Super Clinics offers one service that has the following annual cost and volume estimates: Variable cost per visit = $10 Annual direct fixed costs = $50,000 Allocation of overhead costs = $20,000 Expected volume = 1,000 visits What price per visit must be set if the clinic wants to make an annual profit of $10,000 on the full cost of the service?arrow_forwardSchylar Pharmaceuticals, Inc., plans to sell 130,000 units of antibiotic at an average price of 22 each in the coming year. Total variable costs equal 1,086,800. Total fixed costs equal 8,000,000. (Round all ratios to four significant digits, and round all dollar amounts to the nearest dollar.) Required: 1. What is the contribution margin per unit? What is the contribution margin ratio? 2. Calculate the sales revenue needed to break even. 3. Calculate the sales revenue needed to achieve a target profit of 245,000. 4. What if the average price per unit increased to 23.50? Recalculate: a. Contribution margin per unit b. Contribution margin ratio (rounded to four decimal places) c. Sales revenue needed to break even d. Sales revenue needed to achieve a target profit of 245,000arrow_forwardSchylar Pharmaceuticals, Inc., plans to sell 120,000 units of antibiotic at an average price of $18 each in the coming year. Total variable costs equal $820,800. Total fixed costs equal $7,600,000. 1. What if the average price per unit increased to $19.50? Recalculate the following: a. Contribution margin per unit. Round your answer to the nearest cent. b. Contribution margin ratio. Enter your answer as a decimal value (not a percentage), rounded to four decimal places. c. Sales revenue needed to break even. In your computations, use your rounded answer from part (4-b) above for the contribution margin ratio, and round your final answer to the nearest dollar. d. Sales revenue needed to achieve a target profit of $270,000. In your computations, use your rounded answer from part (4-b) above for the contribution margin ratio, and round your final answer to the nearest dollar.arrow_forward
- fixed cost=650000.00 variable cost per procedure=20 procedures per year =12500 what is the underlying cost structure? what is the expected total cost?arrow_forwardGiven that Blackboard Clinic has fixed costs of $1,000,000 and a total cost forecast of $1,700,000 at a volume of 25,000 patient visits. What is the clinic's variable cost rate?arrow_forwardA responsibility center's contribution margin ratio is 40%, and its common fixed costs are currently $100,000. If the center's sales increase by $300,000 and its common fixed costs increase by $20,000, its responsibility margin will increase by $_? -Why is the answer $100,000?arrow_forward
- The University of Ghana would want to increase the number of students by 10%. However, management would have to increase the number of lecturers which will result into 15% rise in compensation expense. This thus makes the additional expense a/an OA. incremental cost and relevant cost as well O B. fixed cost and relevant cost as well OC. variable cost and opportunity cost as well D. relevant cost and sunk cost as wellarrow_forwardTotal fixed cost of a product is IDR 10,000,000 and variable cost is IDR 50,000 per unit. The sale price is IDR.75,000 per unit . How much products should be produced to get BEP? Prove your answer and make a graphic. ..And If the company need profit IDR 10,000,000. How much is the sales price? Prove your answer.arrow_forwardDerby Phones is considering the introduction of a new model of headphones with the following price and cost characteristics. Sales price $ 22 per unit Variable costs 5 per unit Fixed costs 25,000 per month Assume that the projected number of units sold for the month is 7,000. Consider requirements (b), (c), and (d) independently of each other. Required: a. What will the operating profit be? b. What is the impact on operating profit if the sales price decreases by 10 percent? Increases by 20 percent? c. What is the impact on operating profit if variable costs per unit decrease by 10 percent? Increase by 20 percent? d. Suppose that fixed costs for the year are 10 percent lower than projected, and variable costs per unit are 10 percent higher than projected. What impact will these cost changes have on operating profit for the year? Will profit go up? Down? By how much?arrow_forward
- How do you compute the monthly margn of safety in dollars if the shop has a monthly target profit of $54000, variable costs are 20% and monthly fixted cost of $18000 and what is the margin of safety percentage of target sales?arrow_forwardDerby Phones is considering the introduction of a new model of headphones with the following price and cost characteristics. Sales price $ 21 per unit Variable costs 7 per unit Fixed costs 27,000 per month Assume that the projected number of units sold for the month is 7,000. consider requirements (b), (c), and (d) independently of each other. Required: a. What will the operating profit be? B. What is the impact on operating profit if the sales price decreases by 10 percent? Increases by 20 percent? c. What is the impact on operating profit if variable costs per unit decrease by 10 percent? Increase by 20 percent? d. suppose that fixed costs for the year are 10 percent lower than projected, and variable costs per unit are 10 percent higher than projected. What impact will these cost changes have on operating profit for the year? Will profit go up? Down? By how much? complete this question by entering your…arrow_forwardAnalysis of a project: In determining the annual profit of a project the following information is used: Variable costs are S /. 10 per unit, fixed costs vary according to the level of production in the following image: If the sale price is S /. 24 and sales of 15,000 units are expected, in addition, an annual profit of S /. 140,000. How many additional units must be sold at a price of S /. 20?arrow_forward
 Cornerstones of Cost Management (Cornerstones Ser...AccountingISBN:9781305970663Author:Don R. Hansen, Maryanne M. MowenPublisher:Cengage Learning