
Principles of Corporate Finance (Mcgraw-hill/Irwin Series in Finance, Insurance, and Real Estate)
12th Edition
ISBN: 9781259144387
Author: Richard A Brealey, Stewart C Myers, Franklin Allen
Publisher: McGraw-Hill Education
expand_more
expand_more
format_list_bulleted
Concept explainers
Videos
Textbook Question
Chapter 5, Problem 6PS
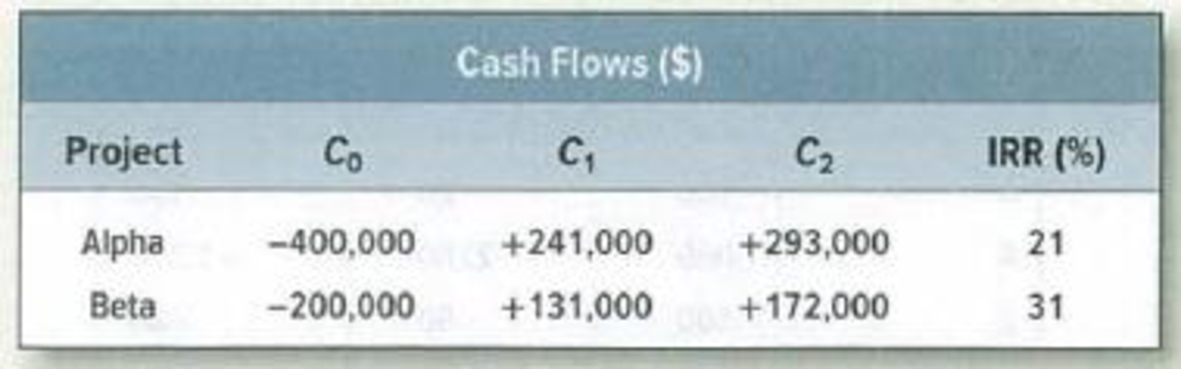
The opportunity cost of capital is 8%. Suppose you can undertake Alpha or Beta, but not both. Use the IRR rule to make the choice. (Hint: What’s the incremental investment in Alpha?)
Expert Solution & Answer

Trending nowThis is a popular solution!

Students have asked these similar questions
Compute the Profitability Index (PI) for each project?
Project A
Project B
Profitability Index (PI)
5- In light of your answers above, suppose that these two projects might be mutually exclusive or independent. According to these two assumptions, fill in the blanks in the table below with the suitable answer:
Points
Investment Criteria
If A and B are mutually exclusive, then I would select
If A and B are independent, then I would select
PBP
NPV
IRR
PI
The blue curve (labeled "L") depicts the NPV for a project with larger cash flows later of -$1,000, $100, $300, $400, and $675. The red curve (labeled "S") depicts the NPV for a project with larger cash flows sooner of -$1,000, $500, $400, $300, and $100. Drag on the graph either left or right to
change the cost of capital interest rate at which the NPV is evaluated for the two projects.
NPV ($)
500-
400
300
200-
100.40100-
78.82
0
-100-
Project S: NPV = CF₁+N CF₁
-=1 (1+r)
N CF₂
Project L: NPV = CF₁ + Σ = 1 (1+r) ²
+ ΣΜ = = -S1, 000 +
²
L
¡=-$1,000+
S
15
$500
$400
$300
$100
(1+0.1000)¹ (1+0.1000)² (1+0.1000)³ (1+0.1000)*
20
+
Cost of Capital (%)
$100
$300
$400
$675
(1+0.1000)¹ (1+0.1000) (1+0.1000)³ (1+0.1000)*
+
+
+
+
+
= $78.82
= $100.40
An NPV profile plots a project's NPV at various costs of capital, labeled "A" and "B" in the graph. A project's NPV profile is shown as follows. Identify
the range of costs (ranges labeled "A" and "B") of capital that a firm would use to accept and reject this project.
A-Z
NPV (Dollars)
400
dofice
300
200
A
100
B
-100
-200
0 2
4 6 8 10 12 14 16 18 20
COT OF CAPITAL (Percent)
A
WACC
IRR
The point at which the NPV profile intersects the horizontal axis represents the
Chapter 5 Solutions
Principles of Corporate Finance (Mcgraw-hill/Irwin Series in Finance, Insurance, and Real Estate)
Ch. 5 - (IRR) Check the IRRs for project F in Section 5-3.Ch. 5 - (IRR) What is the IRR of a project with the...Ch. 5 - (XIRR) What is the IRR of a project with the...Ch. 5 - Payback a. What is the payback period on each of...Ch. 5 - IRR Write down the equation defining a projects...Ch. 5 - Prob. 3PSCh. 5 - IRR rule You have the chance to participate in a...Ch. 5 - IRR rule Consider a project with the following...Ch. 5 - IRR rule Consider projects Alpha and Beta: The...Ch. 5 - Capital rationing Suppose you have the following...
Ch. 5 - Payback Consider the following projects: a. If the...Ch. 5 - Prob. 9PSCh. 5 - IRR Calculate the IRR (or IRRs) for the following...Ch. 5 - IRR rule Consider the following two mutually...Ch. 5 - IRR rule Mr. Cyrus Clops, the president of Giant...Ch. 5 - Prob. 13PSCh. 5 - Profitability index Look again at projects D and E...Ch. 5 - Prob. 15PSCh. 5 - Prob. 16PS
Knowledge Booster


Learn more about
Need a deep-dive on the concept behind this application? Look no further. Learn more about this topic, finance and related others by exploring similar questions and additional content below.Similar questions
- Finance Questionarrow_forwardK Internal rate of return and modified internal rate of return For the project shown in the following table,, calculate the internal rate of return (IRR) and modified internal rate of return (MIRR). If the cost of capital is 13.04%, indicate whether the project is acceptable according to IRR and MIRR. The project's IRR is %. (Round to two decimal places.) Data table (Click on the icon here in order to copy the contents of the data table below into a spreadsheet.) Initial investment (CFO) Year (t) $80,000 Cash inflows (CF₂) 1 $10,000 2345 $25,000 $10,000 $15,000 $45,000 Print Done -arrow_forward3e.a.Determinethe payback period for each b.Calculatethe net present value (NPV) for each c.Calculatethe profitability index (PI) for each project. d.Calculatethe internal rate of return (IRR) for each e.Basedon ALL your answers above, explain briefly which project should be Note: i just need (e) no question answer not all no need excle formula , thank youarrow_forward
- You look at the rate of returns, and the betas of different capital investment options. To determine which should be pursued, you will look at Internal Rate of Return, the Capital Asset Pricing Model (Security Market Line), and the Weighted Average Cost of Capital. The expected return on the market is 12%, and the risk-free rate is 5%. Project Z: return = 17.0%, beta = 1.81 Project X: return = 10.5%, beta = .90 Project W: return = 10.0%, beta = .55 Project Y: return = 14.0%, beta = 1.10 a. Which projects should be accepted using the CAPM(SML) rule? Project W should be Project Y should be Project X should be and Project Z should bearrow_forwardAnswer this question as it is pertaining to two MUTUALLY EXCLUSIVE projects on the following figure. Given r=6%, which project would you choose if you decide to use the internal rate of return (IRR) as the criterion? Group of answer choices Project A Project B Neither Eitherarrow_forward5. NPV profiles An NPV profile plots a project's NPV at various costs of capital, labeled "A" and "B" in the graph. A project's NPV profile is shown as follows. Identify the range of costs (ranges labeled "A" and "B") of capital that a firm would use to accept and reject this project. A B NPV (Dollars) 400 300 200 100 0 -100 -200 A 0 2 4 6 8 10 10 12 14 16 18 20 COST OF CAPITAL (Percent) True B True or False: The NPV and IRR methods can lead to conflicting decisions for mutually exclusive projects. Falsearrow_forward
- Start with the partial model in the file Ch10 P23 Build a Model.xlsx on the textbooks Web site. Gardial Fisheries is considering two mutually exclusive investments. The projects expected net cash flows are as follows: a. If each projects cost of capital is 12%, which project should be selected? If the cost of capital is 18%, what project is the proper choice? b. Construct NPV profiles for Projects A and B. c. What is each projects IRR? d. What is the crossover rate, and what is its significance? e. What is each projects MIRR at a cost of capital of 12%? At r = 18%? (Hint: Consider Period 7 as the end of Project Bs life.) f. What is the regular payback period for these two projects? g. At a cost of capital of 12%, what is the discounted payback period for these two projects? h. What is the profitability index for each project if the cost of capital is 12%?arrow_forwardWhich of the following projects would you feel safest in accepting? Assume the opportunity cost of capital is 12% for each project. ☐(a) “Project A” that has a small, but negative, NPV. ☐(b) “Project B” that has a positive NPV when discounted at 10%. ☐(c) “Project C” that has a cost of capital that exceeds its internal rate of return. ☐(d) “Project D” that has a zero NPV when discounted at 14%. darrow_forward5. NPV profiles An NPV profile plots a project's NPV at various costs of capital, labeled "A" and "B" in the graph. A project's NPV profile is shown as follows. Identify the range of costs (ranges labeled "A" and "B") of capital that a firm would use to accept and reject this project. A B NPV (Dollars) 400 300 200 100 0 -100 -200 0 2 A B 4 6 8 10 12 14 16 18 20 COST OF CAPITAL (Percent) The point at which the NPV profile intersects the horizontal axis represents thearrow_forward
- What are the internal rates of return (IRR) on the three projects? Does the IRR rule in this case give the same decision as NPV? How do you know? If the opportunity cost of capital is 11%, what is the profitability index for each project? Please analyze if, in general, decisions based on the profitability index are consistent with decisions based on NPV. What is the most generally accepted measure to choose between the projects? Please justify your answer. Project A -5000 +1000 +1000 +3000 0 B -1000 0 +1000 +2000 +3000 C -5000 +1000 +1000 +3000 +5000 I will need full analysis (qualitative examples and references citations and examples of relative current investments of big companies.arrow_forward8. NPV profiles An NPV profile plots a project's NPV at various costs of capital. An example NPV profile is shown below: Identify the range of costs of capital that a firm would use to accept and reject this project, and answer the questions that follow. NPV (Dollars) 600 500 400 300 200 100 0 ← -100 -200 -300 A 2 4 6 8 10 12 14 16 DISCOUNT (REQUIRED) RATE (Percent) The project represented by triangle A should be B 18 20 This NPV profile demonstrates that as the cost of capital increases, the project's NPV ?arrow_forwardAn NPV profile plots a project's NPV at various costs of capital, labeled "A" and "B" in the graph. A project's NPV profile is shown as follows. Identify the range of costs (ranges labeled "A" and "B") of capital that a firm would use to accept and reject this project. NPV (Dollars) 400 300 200 100 B -100 -200 O 2 4 6 8 10 12 14 16 18 20 COST OF CAPITAL (Percent) A В The point at which the NPV profile intersects the horizontal axis represents thearrow_forward
arrow_back_ios
SEE MORE QUESTIONS
arrow_forward_ios
Recommended textbooks for you


Capital Budgeting Introduction & Calculations Step-by-Step -PV, FV, NPV, IRR, Payback, Simple R of R; Author: Accounting Step by Step;https://www.youtube.com/watch?v=hyBw-NnAkHY;License: Standard Youtube License