Interpretation:
Each line in the phase diagram, in terms of the derivative it represents, is to be labeled.
Concept introduction:
Phase diagram represents the different physical states of a substance at different values of temperature and pressure. In the water, the molar volume of solid is greater than the molar volume of the liquid.
Answer to Problem 6.66E
The phase transition between solid phase to liquid phase is represented by the derivative,
The phase transition between solid phase to liquid phase is represented by the derivative,
The phase transition between solid phase to liquid phase is represented by the derivative,
The phase transition between solid phases is represented by the derivative,
Explanation of Solution
The phase diagram of water shown in Figure 6.6 is shown below.
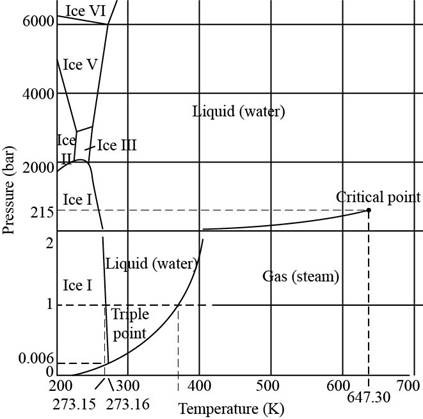
Figure 1
In the given diagram, the total numbers of phase transitions represented are,
1. Gas phase to liquid phase
2. Gas phase to ice phase
3. Liquid phase to ice phase
4. Liquid phase to ice phase
5. Liquid phase to ice phase
6. Liquid phase to ice phase
7. Ice phase
8. Ice phase
9. Ice phase
10. Ice phase
11. Ice phase
12. Ice phase
Thus, the total number of phase transitions are
The phase transition between solid phase to liquid phase, that is, ice phase
Where,
•
•
The phase transition between gas phase to ice phase
Where,
•
•
The volume of gas is much greater than the volume of solid. Therefore, it can be neglected.
The phase transition between solid phase and liquid phase is represented by the derivative,
Where,
•
•
The volume of gas is much greater than the volume of liquid. Therefore, it can be neglected.
The phase transition between solid phases is represented by the derivative,
Where,
•
•
The phase transition between solid phase to liquid phase is represented by the derivative,
The phase transition between solid phase to liquid phase is represented by the derivative,
The phase transition between solid phase to liquid phase is represented by the derivative
The phase transition between solid phases is represented by the derivative,
Want to see more full solutions like this?
Chapter 6 Solutions
Physical Chemistry

- Use the phase diagram of water in Figure 6.6 and count the total number of phase transitions that are represented.arrow_forwardGiven the following data about xenon, normalboilingpoint=108Cnormalmeltingpoint=112Ctriplepoint=121Cat281mmHgcriticalpoint=16.6Cat58atm (a) Construct an approximate phase diagram for xenon. (b) Estimate the vapor pressure of xenon at -115C. (c) Is the density of solid Xe larger than that for liquid Xe?arrow_forward6.The diagram below is an example of Liquid-Vapor(LV) Pressure (P vs Mole Fraction).Fill out the question marks with correct number of degrees of freedom. LV Pressure – Composition (LV – PZ) Phase Diagram | How to read this phase diagram: XA = 0 Xe = 1 P = Pg Xx = 1 • We can designate the fraction of A and B in the liquid be XA and Xa, while the fraction of A and B in the gas phase be ya and Yg- XB = 0 F=? Liquid Phase F=? • Z, is the composition of A: • Below the vapor curve, or the bubble curve, A is pure vapor, and Z, = VA • Above the liquid curve, or the dew curve, A is pure liquid, and Z, = Xa P P= P F=? Vapor Phase YA = 1 YA = 0 Ya = 1 ZA Ys = 0arrow_forward
- 6a. Based on the plot below, what is the enthalpy of vaporization for the compound? a. 63.09 kJ/mol b. -63.09 kJ/mol c. 7.589 kJ/mol d. -7.589 kJ/mol In (P) y = -7589x + 24.963 R² = 1 1/T (1/K)arrow_forwardYour classmate reasons that since you can have a cup of water with ice present at room temperature and at sea level, the phase diagram of H2O is incorrect. What is incorrect with their reasoning?arrow_forward2. All liquids have characteristic vapor pressure that vary with temperature. The characteristic vapor pressure for pure water at 22°C is 19.827 mm Hg and at 30.0°C is 31.824 mm Hg. Use these data to calculate the change in enthalphy per mole for the vaporizationarrow_forward
- What is represented by A on the phase diagram?arrow_forwardThe next phase diagram looks at the effect of changing pressure at constant temperature. Name and explain the significance of the point C.arrow_forwardThe latent heat of fusion of water at 0Cis 6.025 kJ/mol and the molar heat capacities (Cp,m) of water and ice are 75.3 and 37.7 J K-1 mol-1, respectively. The Cp values can be taken to be independent of temperature. Calculate H for the freezing of 1 mol of supercooled water at -10.0C.arrow_forward
- (a) Identify the major phases (ice, water, vapor) on the unary phase diagram of H2O below.arrow_forwardWhy is it important that the heat capacity, latent heat of fusion and latent heat of vaporization of water are high?arrow_forward(a) Two pans of water are on different burners of a stove. Onepan of water is boiling vigorously, while the other is boilinggently. What can be said about the temperature of the waterin the two pans? (b) A large container of water and a smallone are at the same temperature. What can be said about therelative vapor pressures of the water in the two containers?arrow_forward
 Physical ChemistryChemistryISBN:9781133958437Author:Ball, David W. (david Warren), BAER, TomasPublisher:Wadsworth Cengage Learning,
 Chemistry: Matter and ChangeChemistryISBN:9780078746376Author:Dinah Zike, Laurel Dingrando, Nicholas Hainen, Cheryl WistromPublisher:Glencoe/McGraw-Hill School Pub Co
 Chemistry: The Molecular ScienceChemistryISBN:9781285199047Author:John W. Moore, Conrad L. StanitskiPublisher:Cengage Learning
 Chemistry: Principles and ReactionsChemistryISBN:9781305079373Author:William L. Masterton, Cecile N. HurleyPublisher:Cengage Learning
 Introductory Chemistry: A FoundationChemistryISBN:9781337399425Author:Steven S. Zumdahl, Donald J. DeCostePublisher:Cengage Learning