
Concept explainers
Videos
(a)
Find the z interval for
(a)
Answer to Problem 11P
The z interval for
Explanation of Solution
Calculation:
Z score:
The number of standard deviations the original measurement x is from the value of
In the formula, x is the raw score,
The variable x is red blood cell (RBC) count in millions per cubic millimetre for women. The healthy females are
For the z interval consider,
Subtract 4.8 on both sides of the inequality.
Divide 0.3 on both sides of the inequality.
Hence, the z interval for
(b)
Find the z interval for
(b)
Answer to Problem 11P
The z interval for
Explanation of Solution
Calculation:
For the z interval consider,
Subtract 4.8 on both sides of the inequality.
Divide 0.3 on both sides of the inequality.
Hence, the z interval for
(c)
Find the z interval for
(c)
Answer to Problem 11P
The z interval for
Explanation of Solution
Calculation:
For the z interval consider,
Subtract 4.8 for each part of the inequality.
Divide 4.3 for each part of the inequality.
Hence, the z interval for
(d)
Find the x interval for
(d)
Answer to Problem 11P
The x interval for
Explanation of Solution
Calculation:
The z score is,
For the x interval consider,
Multiply 0.3 on both sides of the inequality.
Add 4.8 on both sides of the inequality.
Hence, the x interval for
(e)
Find the x interval for
(e)
Answer to Problem 11P
The x interval for
Explanation of Solution
Calculation:
For the x interval consider,
Multiply 0.3 on both sides of the inequality.
Add 4.8 on both sides of the inequality.
Hence, the x interval for
(f)
Find the x interval for
(f)
Answer to Problem 11P
The x interval for
Explanation of Solution
Calculation:
For the x interval consider,
Multiply 0.3 for each part of the inequality.
Add 4.8 for each part of the inequality.
Hence, the x interval for
(g)
Identify whether the RBC count of 5.9 or higher can be considered unusually high or not using z values and Figure 6-15.
(g)
Answer to Problem 11P
The RBC count of 5.9 or higher is unusually high.
Explanation of Solution
Calculation:
The RBC count of 5.9 or higher, that is
Subtract 4.8 on both sides of the inequality.
Divide 0.3 on both sides of the inequality.
The RBC count of 5.9 or higher is 3.67 standard deviations above the mean value. The z score value is greater than 3 indicating that the value is very unusual.
The figure 6-15 is the standard normal distribution curve. The z value is located on the curve as below.
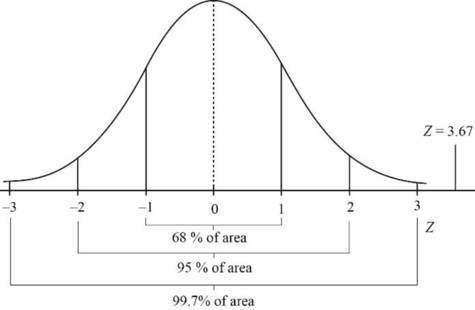
The z value that is far from the mean (zero) is considered as unusual. If the value is closer to –3 is usually very small and value closer to 3 is usually very large.
If the value of z for RBC count of 5.9 or higher is greater to 3 then RBC count would be very large and unusual.
Want to see more full solutions like this?
Chapter 6 Solutions
Understandable Statistics: Concepts and Methods


- Respiratory Rate Researchers have found that the 95 th percentile the value at which 95% of the data are at or below for respiratory rates in breath per minute during the first 3 years of infancy are given by y=101.82411-0.0125995x+0.00013401x2 for awake infants and y=101.72858-0.0139928x+0.00017646x2 for sleeping infants, where x is the age in months. Source: Pediatrics. a. What is the domain for each function? b. For each respiratory rate, is the rate decreasing or increasing over the first 3 years of life? Hint: Is the graph of the quadratic in the exponent opening upward or downward? Where is the vertex? c. Verify your answer to part b using a graphing calculator. d. For a 1- year-old infant in the 95 th percentile, how much higher is the walking respiratory rate then the sleeping respiratory rate? e. f.arrow_forwardPlanetary Velocity The following table gives the mean velocity of planets in their orbits versus their mean distance from the sun. Note that 1AU astronomical unit is the mean distance from Earth to the sun, abut 93 million miles. Planet d=distance AU v=velocity km/sec Mercury 0.39 47.4 Venus 0.72 35.0 Earth 1.00 29.8 Mars 1.52 24.1 Jupiter 5.20 13.1 Saturn 9.58 9.7 Uranus 19.20 6.8 Neptune 30.05 5.4 Astronomers tell us that it is reasonable to model these data with a power function. a Use power regression to express velocity as a power function of distance from the sun. b Plot the data along with the regression equation. c An asteroid orbits at a mean distance of 3AU from the sun. According to the power model you found in part a, what is the mean orbital velocity of the asteroid?arrow_forward
 Calculus For The Life SciencesCalculusISBN:9780321964038Author:GREENWELL, Raymond N., RITCHEY, Nathan P., Lial, Margaret L.Publisher:Pearson Addison Wesley,
 Algebra & Trigonometry with Analytic GeometryAlgebraISBN:9781133382119Author:SwokowskiPublisher:Cengage
 Functions and Change: A Modeling Approach to Coll...AlgebraISBN:9781337111348Author:Bruce Crauder, Benny Evans, Alan NoellPublisher:Cengage Learning
 Glencoe Algebra 1, Student Edition, 9780079039897...AlgebraISBN:9780079039897Author:CarterPublisher:McGraw Hill
 Holt Mcdougal Larson Pre-algebra: Student Edition...AlgebraISBN:9780547587776Author:HOLT MCDOUGALPublisher:HOLT MCDOUGAL
 Big Ideas Math A Bridge To Success Algebra 1: Stu...AlgebraISBN:9781680331141Author:HOUGHTON MIFFLIN HARCOURTPublisher:Houghton Mifflin Harcourt