
Elementary Statistics: Picturing the World (7th Edition)
7th Edition
ISBN: 9780134683416
Author: Ron Larson, Betsy Farber
Publisher: PEARSON
expand_more
expand_more
format_list_bulleted
Concept explainers
Videos
Textbook Question
Chapter 7.1, Problem 19E
Graphical Analysis In Exercises 17–20, match the alternative hypothesis with its graph. Then state the null hypothesis and sketch its graph.
19. Ha: μ ≠ 3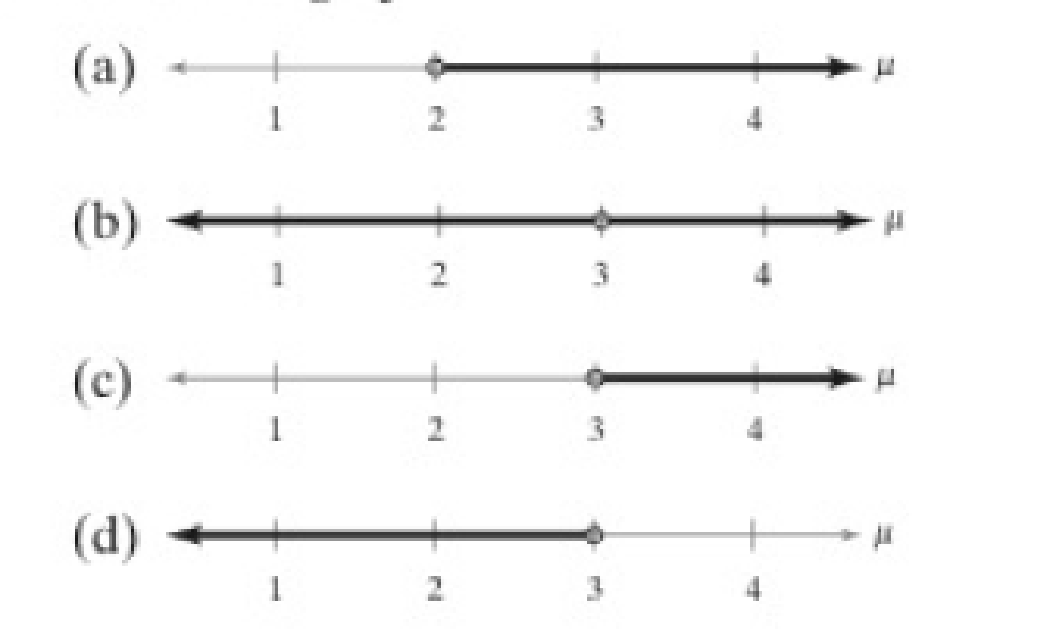
Expert Solution & Answer
Want to see the full answer?
Check out a sample textbook solution
Students have asked these similar questions
Regression and Predictions. Exercises 13–28 use the same data sets as Exercises 13–28 in Section 10-1. In each case, find the regression equation, letting the first variable be the predictor (x) variable. Find the indicated predicted value by following the prediction procedure summarized in Figure 10-5 on page 493.
Old Faithful Using the listed duration and interval after times, find the best predicted “interval after” time for an eruption with a duration of 253 seconds. How does it compare to an actual eruption with a duration of 253 seconds and an interval after time of 83 minutes?
section 4.1 #30
In Exercises 25–30, determine whether the association between the two variables is positive or negative.
Weekly ice cream sales and weekly average temperature
Reading is fundamental to a teenager's ability to perform well in school. Assume a researcher is
interested in the ability of the number of books read over the summer to predict ACT Reading
scores. Using a random sample of 10 random high school students the researchers recorded the
number of books read over the summer and the students' ACT Reading scores.
Books Read (X) ACT Score (Y) (X- Xmean)
(Y - Ymean)
(X-Xmean)(Y-Ymean) (X-Xmean)?
(Y - Ymean)?
2
16
-5.4
-14.9
81
29
221
2
19
-5.4
-11.9
64
29
141
3
17
-4.4
-13.9
61
20
192
4
25
-3.4
-5.9
20
12
34
21
-3.4
-9.9
34
12
97
24
-1.4
-6.9
10
2
47
6
21
-1.4
-9.9
14
2
97
8
24
0.6
-6.9
-4
47
7
27
-0.4
-3.9
2
15
10
22
2.6
-8.9
-23
7
78
Total
52
216
259.1
113.3
969.3
МEAN
7.4
30.9
a. Identify the regression line using the number of books read to predict ACT Reading
score. Use a = .05 to evaluate the quality of the prediction of the regression line.
b. What is the predicted ACT Reading score when 5 books are read?
Chapter 7 Solutions
Elementary Statistics: Picturing the World (7th Edition)
Ch. 7.1 - Write each claim as a mathematical statement....Ch. 7.1 - A company specializing in parachute assembly...Ch. 7.1 - For each claim, state H0 and Ha in words and in...Ch. 7.1 - You perform a hypothesis test for each claim. How...Ch. 7.1 - 1. You represent a chemical company that is being...Ch. 7.1 - What are the two types of hypotheses used in a...Ch. 7.1 - Describe the two types of errors possible in a...Ch. 7.1 - Prob. 3ECh. 7.1 - Does failing to reject the null hypothesis mean...Ch. 7.1 - True or False? In Exercises 510, determine whether...
Ch. 7.1 - True or False? In Exercises 510, determine whether...Ch. 7.1 - True or False? In Exercises 510, determine whether...Ch. 7.1 - True or False? In Exercises 510, determine whether...Ch. 7.1 - True or False? In Exercises 510, determine whether...Ch. 7.1 - True or False? In Exercises 510, determine whether...Ch. 7.1 - Stating Hypotheses In Exercises 1116, the...Ch. 7.1 - Stating Hypotheses In Exercises 1116, the...Ch. 7.1 - Stating Hypotheses In Exercises 1116, the...Ch. 7.1 - Stating Hypotheses In Exercises 1116, the...Ch. 7.1 - Stating Hypotheses In Exercises 1116, the...Ch. 7.1 - Stating Hypotheses In Exercises 1116, the...Ch. 7.1 - Graphical Analysis In Exercises 1720, match the...Ch. 7.1 - Graphical Analysis In Exercises 1720, match the...Ch. 7.1 - Graphical Analysis In Exercises 1720, match the...Ch. 7.1 - Graphical Analysis In Exercises 1720, match the...Ch. 7.1 - Identifying a Test In Exercises 2124, determine...Ch. 7.1 - Identifying a Test In Exercises 2124, determine...Ch. 7.1 - Identifying a Test In Exercises 2124, determine...Ch. 7.1 - Identifying a Test In Exercises 2124, determine...Ch. 7.1 - Stating the Null and Alternative Hypotheses In...Ch. 7.1 - Stating the Null and Alternative Hypotheses In...Ch. 7.1 - Stating the Null and Alternative Hypotheses In...Ch. 7.1 - Stating the Null and Alternative Hypotheses In...Ch. 7.1 - Stating the Null and Alternative Hypotheses In...Ch. 7.1 - Stating the Null and Alternative Hypotheses In...Ch. 7.1 - Identifying Type I and Type II Errors In Exercises...Ch. 7.1 - Identifying Type I and Type II Errors In Exercises...Ch. 7.1 - Identifying Type I and Type II Errors In Exercises...Ch. 7.1 - Identifying Type I and Type II Errors In Exercises...Ch. 7.1 - Identifying Type I and Type II Errors In Exercises...Ch. 7.1 - Identifying Type I and Type II Errors In Exercises...Ch. 7.1 - Identifying the Nature of a Hypothesis Test In...Ch. 7.1 - Identifying the Nature of a Hypothesis Test In...Ch. 7.1 - Identifying the Nature of a Hypothesis Test In...Ch. 7.1 - Identifying the Nature of a Hypothesis Test In...Ch. 7.1 - Identifying the Nature of a Hypothesis Test In...Ch. 7.1 - Identifying the Nature of a Hypothesis Test In...Ch. 7.1 - Interpreting a Decision In Exercises 4348,...Ch. 7.1 - Interpreting a Decision In Exercises 4348,...Ch. 7.1 - Interpreting a Decision In Exercises 4348,...Ch. 7.1 - Interpreting a Decision In Exercises 4348,...Ch. 7.1 - Interpreting a Decision In Exercises 4348,...Ch. 7.1 - Interpreting a Decision In Exercises 4348,...Ch. 7.1 - Writing Hypotheses: Medicine A medical research...Ch. 7.1 - Writing Hypotheses: Transportation Network Company...Ch. 7.1 - Writing Hypotheses: Backpack Manufacturer A...Ch. 7.1 - Writing Hypotheses: Internet Provider An Internet...Ch. 7.1 - Prob. 53ECh. 7.1 - Getting at the Concept Explain why a level of...Ch. 7.1 - Prob. 55ECh. 7.1 - Prob. 56ECh. 7.1 - Graphical Analysis In Exercises 5760, you are...Ch. 7.1 - Graphical Analysis In Exercises 5760, you are...Ch. 7.1 - Graphical Analysis In Exercises 5760, you are...Ch. 7.1 - Graphical Analysis In Exercises 5760, you are...Ch. 7.2 - The P-value for a hypothesis test is P = 0.0745....Ch. 7.2 - Find the P-value for a left-tailed hypothesis test...Ch. 7.2 - Find the P-value for a two-tailed hypothesis test...Ch. 7.2 - Homeowners claim that the mean speed of...Ch. 7.2 - According to a study of employed U.S. adults ages...Ch. 7.2 - Repeat Example 6 using a level of significance of ...Ch. 7.2 - Find the critical value and rejection region for a...Ch. 7.2 - Find the critical values and rejection regions for...Ch. 7.2 - The CEO of the company in Example 9 claims that...Ch. 7.2 - In Example 10, at = 0.01, is there enough...Ch. 7.2 - Explain the difference between the z-test for ...Ch. 7.2 - In hypothesis testing, does using the critical...Ch. 7.2 - Interpreting a P-Value In Exercises 38, the...Ch. 7.2 - Interpreting a P-Value In Exercises 38, the...Ch. 7.2 - Interpreting a P-Value In Exercises 38, the...Ch. 7.2 - Interpreting a P-Value In Exercises 38, the...Ch. 7.2 - Interpreting a P-Value In Exercises 38, the...Ch. 7.2 - Interpreting a P-Value In Exercises 38, the...Ch. 7.2 - Finding a P-Value In Exercises 914, find the...Ch. 7.2 - Finding a P-Value In Exercises 914, find the...Ch. 7.2 - Finding a P-Value In Exercises 914, find the...Ch. 7.2 - Finding a P-Value In Exercises 914, find the...Ch. 7.2 - Finding a P-Value In Exercises 914, find the...Ch. 7.2 - Finding a P-Value In Exercises 914, find the...Ch. 7.2 - Graphical Analysis In Exercises 15 and 16, match...Ch. 7.2 - Graphical Analysis In Exercises 15 and 16, match...Ch. 7.2 - In Exercises 17 and 18, use the TI-84 Plus...Ch. 7.2 - In Exercises 17 and 18, use the TI-84 Plus...Ch. 7.2 - Finding Critical Values and Rejection Regions In...Ch. 7.2 - Finding Critical Values and Rejection Regions In...Ch. 7.2 - Finding Critical Values and Rejection Regions In...Ch. 7.2 - Finding Critical Values and Rejection Regions In...Ch. 7.2 - Finding Critical Values and Rejection Regions In...Ch. 7.2 - Finding Critical Values and Rejection Regions In...Ch. 7.2 - Graphical Analysis In Exercises 25 and 26, state...Ch. 7.2 - Graphical Analysis In Exercises 25 and 26, state...Ch. 7.2 - In Exercises 2730, test the claim about the...Ch. 7.2 - In Exercises 2730, test the claim about the...Ch. 7.2 - In Exercises 2730, test the claim about the...Ch. 7.2 - In Exercises 2730, test the claim about the...Ch. 7.2 - Hypothesis Testing Using a P-Value In Exercises...Ch. 7.2 - Hypothesis Testing Using a P-Value In Exercises...Ch. 7.2 - Hypothesis Testing Using a P-Value In Exercises...Ch. 7.2 - Hypothesis Testing Using a P-Value In Exercises...Ch. 7.2 - Hypothesis Testing Using a P-Value In Exercises...Ch. 7.2 - Hypothesis Testing Using a P-Value In Exercises...Ch. 7.2 - Hypothesis Testing Using Rejection Region(s) In...Ch. 7.2 - Hypothesis Testing Using Rejection Region(s) In...Ch. 7.2 - Hypothesis Testing Using Rejection Region(s) In...Ch. 7.2 - Hypothesis Testing Using Rejection Region(s) In...Ch. 7.2 - Hypothesis Testing Using Rejection Region(s) In...Ch. 7.2 - Hypothesis Testing Using Rejection Region(s) In...Ch. 7.2 - Writing When P , does the standardized test...Ch. 7.2 - Writing In a right-tailed test where P , does the...Ch. 7.3 - Find the critical value for a left-tailed test...Ch. 7.3 - Find the critical value t0 for a right-tailed lest...Ch. 7.3 - Find the critical values t0 and t0 for a...Ch. 7.3 - An industry analyst says that the mean age of a...Ch. 7.3 - The company in Example 5 claims that the mean...Ch. 7.3 - Another department of motor vehicles office claims...Ch. 7.3 - Explain how to find critical values for a...Ch. 7.3 - Explain how to use a t-test to test a hypothesized...Ch. 7.3 - In Exercises 38, find the critical value(s) and...Ch. 7.3 - In Exercises 38, find the critical value(s) and...Ch. 7.3 - In Exercises 38, find the critical value(s) and...Ch. 7.3 - In Exercises 38, find the critical value(s) and...Ch. 7.3 - In Exercises 38, find the critical value(s) and...Ch. 7.3 - In Exercises 38, find the critical value(s) and...Ch. 7.3 - Graphical Analysis In Exercises 912, state whether...Ch. 7.3 - Graphical Analysis In Exercises 912, state whether...Ch. 7.3 - Graphical Analysis In Exercises 912, state whether...Ch. 7.3 - Graphical Analysis In Exercises 912, state whether...Ch. 7.3 - In Exercises 1318, test the claim about the...Ch. 7.3 - In Exercises 1318, test the claim about the...Ch. 7.3 - In Exercises 1318, test the claim about the...Ch. 7.3 - In Exercises 1318, test the claim about the...Ch. 7.3 - In Exercises 1318, test the claim about the...Ch. 7.3 - In Exercises 1318, test the claim about the...Ch. 7.3 - Hypothesis Testing Using Rejection Regions In...Ch. 7.3 - Hypothesis Testing Using Rejection Regions In...Ch. 7.3 - Hypothesis Testing Using Rejection Regions In...Ch. 7.3 - Hypothesis Testing Using Rejection Regions In...Ch. 7.3 - Hypothesis Testing Using Rejection Regions In...Ch. 7.3 - Hypothesis Testing Using Rejection Regions In...Ch. 7.3 - Hypothesis Testing Using Rejection Regions In...Ch. 7.3 - Hypothesis Testing Using Rejection Regions In...Ch. 7.3 - Using a P-Value with a t-Test In Exercises 2730,...Ch. 7.3 - Using a P-Value with a t-Test In Exercises 2730,...Ch. 7.3 - Using a P-Value with a t-Test In Exercises 2730,...Ch. 7.3 - Using a P-Value with a t-Test In Exercises 2730,...Ch. 7.3 - Deciding on a Distribution In Exercises 31 and 32,...Ch. 7.3 - Prob. 32ECh. 7.3 - Writing You are testing a claim and incorrectly...Ch. 7.3 - Set n = 15, Mean = 40, Std. Dev. = 5, and the...Ch. 7.3 - Prob. 2ACh. 7.3 - Set n = 25, Mean = 25, Std. Dev. = 3, and the...Ch. 7.3 - Human Body Temperature: Whats Normal? In an...Ch. 7.3 - Human Body Temperature: Whats Normal? In an...Ch. 7.3 - Human Body Temperature: Whats Normal? In an...Ch. 7.3 - Human Body Temperature: Whats Normal? In an...Ch. 7.3 - Human Body Temperature: Whats Normal? In an...Ch. 7.3 - In an article in the Journal of Statistics...Ch. 7.4 - A researcher claims that more than 90% of U.S....Ch. 7.4 - A researcher claims that 67% of U.S. adults...Ch. 7.4 - Explain how to determine whether a normal...Ch. 7.4 - Explain how to test a population proportion p.Ch. 7.4 - In Exercises 36, determine whether a normal...Ch. 7.4 - In Exercises 36, determine whether a normal...Ch. 7.4 - In Exercises 36, determine whether a normal...Ch. 7.4 - In Exercises 36, determine whether a normal...Ch. 7.4 - Hypothesis Testing Using Rejection Regions In...Ch. 7.4 - Hypothesis Testing Using Rejection Regions In...Ch. 7.4 - Hypothesis Testing Using Rejection Regions In...Ch. 7.4 - Working Students An education researcher claims...Ch. 7.4 - Hypothesis Testing Using Rejection Regions In...Ch. 7.4 - Hypothesis Testing Using Rejection Regions In...Ch. 7.4 - Hypothesis Testing Using a P-Value In Exercises...Ch. 7.4 - Hypothesis Testing Using a P-Value In Exercises...Ch. 7.4 - Hypothesis Testing Using a P-Value In Exercises...Ch. 7.4 - Hypothesis Testing Using a P-Value In Exercises...Ch. 7.4 - Protecting the Environment In Exercises 17 and 18,...Ch. 7.4 - What Are Peoples Attitudes About Protecting the...Ch. 7.4 - Alternative Formula In Exercises 19 and 20, use...Ch. 7.4 - The alternative formula is derived from the...Ch. 7.4 - Set n = 25 and True p = 0.35. Test the claim that...Ch. 7.4 - Prob. 2ACh. 7.5 - Find the critical value02 right-tailed test when n...Ch. 7.5 - Prob. 2TYCh. 7.5 - Prob. 3TYCh. 7.5 - A bottling company claims that the variance of the...Ch. 7.5 - Prob. 5TYCh. 7.5 - A company that offers dieting products and weight...Ch. 7.5 - Explain how to find critical values in a...Ch. 7.5 - Can a critical value for the chi-square test be...Ch. 7.5 - Prob. 3ECh. 7.5 - Prob. 4ECh. 7.5 - In Exercises 512, find the critical value(s) and...Ch. 7.5 - In Exercises 512, find the critical value(s) and...Ch. 7.5 - In Exercises 512, find the critical value(s) and...Ch. 7.5 - In Exercises 512, find the critical value(s) and...Ch. 7.5 - In Exercises 512, find the critical value(s) and...Ch. 7.5 - In Exercises 512, find the critical value(s) and...Ch. 7.5 - In Exercises 512, find the critical value(s) and...Ch. 7.5 - In Exercises 512, find the critical value(s) and...Ch. 7.5 - Graphical Analysis In Exercises 13 and 14, state...Ch. 7.5 - Prob. 14ECh. 7.5 - In Exercises 1522, test the claim about the...Ch. 7.5 - Prob. 16ECh. 7.5 - In Exercises 1522, test the claim about the...Ch. 7.5 - In Exercises 1522, test the claim about the...Ch. 7.5 - In Exercises 1522, test the claim about the...Ch. 7.5 - Prob. 20ECh. 7.5 - In Exercises 1522, test the claim about the...Ch. 7.5 - In Exercises 1522, test the claim about the...Ch. 7.5 - Hypothesis Testing Using Rejection Regions In...Ch. 7.5 - Hypothesis Testing Using Rejection Regions In...Ch. 7.5 - Hypothesis Testing Using Rejection Regions In...Ch. 7.5 - Hypothesis Testing Using Rejection Regions In...Ch. 7.5 - Hypothesis Testing Using Rejection Regions In...Ch. 7.5 - Hypothesis Testing Using Rejection Regions In...Ch. 7.5 - Hypothesis Testing Using Rejection Regions In...Ch. 7.5 - Hypothesis Testing Using Rejection Regions In...Ch. 7.5 - Prob. 31ECh. 7.5 - Prob. 32ECh. 7.5 - Prob. 33ECh. 7.5 - Prob. 34ECh. 7 - EXERCISES In Exercises 13, assume that you work...Ch. 7 - Describe how your report could make a type I...Ch. 7 - Prob. 3UACh. 7 - In Exercises 16, the statement represents a claim....Ch. 7 - In Exercises 16, the statement represents a claim....Ch. 7 - Prob. 7.1.3RECh. 7 - In Exercises 16, the statement represents a claim....Ch. 7 - Prob. 7.1.5RECh. 7 - In Exercises 16, the statement represents a claim....Ch. 7 - In Exercises 710, (a) state the null and...Ch. 7 - Prob. 7.1.8RECh. 7 - Prob. 7.1.9RECh. 7 - In Exercises 710, (a) state the null and...Ch. 7 - In Exercises 11 and 12, find the P-value for the...Ch. 7 - Prob. 7.2.12RECh. 7 - Prob. 7.2.13RECh. 7 - In Exercises 1316, find the critical value(s) and...Ch. 7 - Prob. 7.2.15RECh. 7 - Prob. 7.2.16RECh. 7 - Prob. 7.2.17RECh. 7 - In Exercises 1720, state whether the standardized...Ch. 7 - In Exercises 1720, state whether the standardized...Ch. 7 - In Exercises 1720, state whether the standardized...Ch. 7 - In Exercises 2124, test the claim about the...Ch. 7 - In Exercises 2124, test the claim about the...Ch. 7 - In Exercises 2124, test the claim about the...Ch. 7 - Prob. 7.2.24RECh. 7 - In Exercises 25 and 26, (a) identify the claim and...Ch. 7 - In Exercises 25 and 26, (a) identify the claim and...Ch. 7 - In Exercises 27 and 28, (a) identify the claim and...Ch. 7 - In Exercises 27 and 28, (a) identify the claim and...Ch. 7 - Prob. 7.3.29RECh. 7 - In Exercises 2934, find the critical value(s) and...Ch. 7 - In Exercises 2934, find the critical value(s) and...Ch. 7 - Prob. 7.3.32RECh. 7 - Prob. 7.3.33RECh. 7 - In Exercises 2934, find the critical value(s) and...Ch. 7 - Prob. 7.3.35RECh. 7 - Prob. 7.3.36RECh. 7 - In Exercises 3540, test the claim about the...Ch. 7 - In Exercises 3540, test the claim about the...Ch. 7 - Prob. 7.3.39RECh. 7 - Prob. 7.3.40RECh. 7 - In Exercises 41 and 42, (a) identify the claim and...Ch. 7 - In Exercises 41 and 42, (a) identify the claim and...Ch. 7 - In Exercises 43 and 44, (a) identify the claim and...Ch. 7 - Prob. 7.3.44RECh. 7 - Prob. 7.4.45RECh. 7 - In Exercises 4548, determine whether a normal...Ch. 7 - Prob. 7.4.47RECh. 7 - In Exercises 4548, determine whether a normal...Ch. 7 - Prob. 7.4.49RECh. 7 - In Exercises 49 and 50, (a) identify the claim and...Ch. 7 - Prob. 7.5.51RECh. 7 - Prob. 7.5.52RECh. 7 - Prob. 7.5.53RECh. 7 - Prob. 7.5.54RECh. 7 - Prob. 7.5.55RECh. 7 - Prob. 7.5.56RECh. 7 - Prob. 7.5.57RECh. 7 - In Exercises 5558, test the claim about the...Ch. 7 - Prob. 7.5.59RECh. 7 - Prob. 7.5.60RECh. 7 - Prob. 7.5.61RECh. 7 - Prob. 7.5.62RECh. 7 - Take this quiz as you would take a quiz in class....Ch. 7 - Prob. 2CQCh. 7 - Take this quiz as you would take a quiz in class....Ch. 7 - Prob. 4CQCh. 7 - Prob. 5CQCh. 7 - Prob. 6CQCh. 7 - Take this test as you would take a test in class....Ch. 7 - Take this test as you would take a test in class....Ch. 7 - Take this test as you would take a test in class....Ch. 7 - Take this test as you would take a test in class....Ch. 7 - Take this quiz as you would take a quiz in class....Ch. 7 - Take this test as you would take a test in class....Ch. 7 - Take this quiz as you would take a quiz in class....Ch. 7 - Supporting a Claim You want your test to support a...Ch. 7 - Testing a Claim You want to claim that students at...Ch. 7 - Testing a Claim You want to claim that your...Ch. 7 - EXERCISES 1. The Minilab display below shows a...Ch. 7 - In Exercise 1, you rejected the claim that p =...Ch. 7 - Describe a hypothesis test for Judge Fords random...
Knowledge Booster


Learn more about
Need a deep-dive on the concept behind this application? Look no further. Learn more about this topic, statistics and related others by exploring similar questions and additional content below.Similar questions
- International Visitors The number of internationalvisitors to the United States for selected years 1986–2010 is given in the table below. If you had to pick one of these models to predictthe number of international visitors in the year2020, which model would be the more reasonablechoice?arrow_forwardP Do Homework - Getting Started: Math Review - Google Chrome A mathxl.com/Student/PlayerHomework.aspx?homeworkld%3D611294897&questionld%3D9&flushed%=true&cld%3D6721186¢erwin=Dyes ITMG 1B Econ 2100 E Homework: Getting Started: Math Review Question 4, 2.4 Study Ex... HW Score: 2.82%, 2 of 7 Part 1 of 8 O Points: 0 of 10 The following questions refer to a coordinate graph with the variable X on the horizontal axis and the variable Y on the vertical axis. Complete parts (a) through (h). a. If two points on a line are (X = 4, Y = 3) and (X= 12, Y = 5), what is the slope of the line? The slope of the line is (Enter your response as an integer or a fraction. Simplify your answer.) Grapher Get More Help- e Text Pages 99+ here to searcharrow_forward(Please do not give solution in image format thanku) To test the effect of a new diet on weight loss, a cardiologist has all his patients follow the diet for 8 weeks. At the end of the 8-week period, eighty percent (80%) of the patients experienced statistically significant weight loss. The cardiologist concludes that the new diet is an effective treatment for losing weight, but his conclusion is questionable because the weight loss experienced by the patients may have been due to the placebo effect. In this one-track experiment, the explanatory variable and the placebo effect are Confounded Valid Reliable Stratifiedarrow_forward
- a.State the predictors available in this model.arrow_forwardChapter 6, Section 3-HT, Exercise 168 MORE BENEFITS OF EATING ORGANICUsing data from a study, we find a significant difference in the proportion of fruit flies surviving after 13 days between those eating organic potatoes and those eating conventional (not organic) potatoes. This exercise asks you to conduct a hypothesis test using additional data from this study.1 In this case, we are testing H0:po=pcHa:po>pcwhere po and pc represent the proportion of fruit flies alive at the end of the given time frame of those eating organic food and those eating conventional food, respectively. We have n1=n2=500. Show all remaining details in the test, using a 5% significance level.Effect of Organic Raisins After 20 DaysAfter 20 days, 275 of the 500 fruit flies eating organic raisins are still alive, while 170 of the 500 eating conventional raisins are still alive. 1Proportions approximated from information given in the paper. Give the test…arrow_forwardResearch Question: Does relaxation training impact the severity of asthma symptoms? DV: The # of doses of meds needed for asthma attacks. Conduct a hypothesis test (showing all the steps) using the following data: Patient Week before training Week after training A 9 3 B 4 1 C 5 0 D 4 3 E 7 2 ??=∑?2−(∑?)2?arrow_forward
- Chapter 6, Section 3-HT, Exercise 166 MORE BENEFITS OF EATING ORGANICUsing data from a study, we find a significant difference in the proportion of fruit flies surviving after 13 days between those eating organic potatoes and those eating conventional (not organic) potatoes. This exercise asks you to conduct a hypothesis test using additional data from this study.1 In this case, we are testing H0:po=pcHa:po>pcwhere po and pc represent the proportion of fruit flies alive at the end of the given time frame of those eating organic food and those eating conventional food, respectively. We have n1=n2=500. Show all remaining details in the test, using a 5% significance level.Effect of Organic Raisins After 15 DaysAfter 15 days, 320 of the 500 fruit flies eating organic raisins are still alive, while 300 of the 500 eating conventional raisins are still alive.1Proportions approximated from information given in the paper. Give the test statistic…arrow_forward(Q.8) Mastery Assess It 3 - Question is in the photo privided below.arrow_forwardA researcher selects a sample and administers a treatment for anxiety to the individuals in the sample. If the sample is used for a hypothesis test, what does the alternative hypothesis (H1) put forth about the treatment? Group of answer choices The treatment has no effect on anxiety. The treatment adds a constant to each anxiety score. The treatment multiplies each anxiety score by a constant. The treatment has an effect on anxiety.arrow_forward
- Chapter 5, Section 1, Exercise 018 MORE BENEFITS OF EATING ORGANICUsing specific data, we find a significant difference in the proportion of fruit flies surviving after 13 days between those eating organic potatoes and those eating conventional (not organic) potatoes. This exercise asks you to conduct a hypothesis test using additional data. In this case, we are testing H0 : po= pcHa: po > pc where po and pc represent the proportion of fruit flies alive at the end of the given time frame of those eating organic food and those eating conventional food, respectively. Use a 5% significance level.Effect of Organic Soybeans After 5 DaysAfter 5 days, the proportion of fruit flies eating organic soybeans still alive is 0.92, while the proportion still alive eating conventional soybeans is 0.84. The standard error for the difference in proportions is 0.023.What is the value of the test statistic?Round your answer to two decimal places. z= What is the p-value?Round your answer to…arrow_forwardChapter 5, Section 1, Exercise 019 MORE BENEFITS OF EATING ORGANICUsing specific data, we find a significant difference in the proportion of fruit flies surviving after 13 days between those eating organic potatoes and those eating conventional (not organic) potatoes. This exercise asks you to conduct a hypothesis test using additional data. In this case, we are testing H0 : po= pcHa: po > pc where po and pc represent the proportion of fruit flies alive at the end of the given time frame of those eating organic food and those eating conventional food, respectively. Use a 5% significance level.Effect of Organic Bananas After 25 DaysAfter 25 days, the proportion of fruit flies eating organic bananas still alive is 0.42, while the proportion still alive eating conventional bananas is 0.40. The standard error for the difference in proportions is 0.029.What is the value of the test statistic?Round your answer to two decimal places. z= What is the p-value?Round your answer to…arrow_forwardO.R data preparation is a trivial step, due to the time required and the possibility of data collection errors. True of fallsarrow_forward
arrow_back_ios
SEE MORE QUESTIONS
arrow_forward_ios
Recommended textbooks for you
 Big Ideas Math A Bridge To Success Algebra 1: Stu...AlgebraISBN:9781680331141Author:HOUGHTON MIFFLIN HARCOURTPublisher:Houghton Mifflin Harcourt
 Algebra & Trigonometry with Analytic GeometryAlgebraISBN:9781133382119Author:SwokowskiPublisher:Cengage
Big Ideas Math A Bridge To Success Algebra 1: Stu...
Algebra
ISBN:9781680331141
Author:HOUGHTON MIFFLIN HARCOURT
Publisher:Houghton Mifflin Harcourt
Algebra & Trigonometry with Analytic Geometry
Algebra
ISBN:9781133382119
Author:Swokowski
Publisher:Cengage
Hypothesis Testing - Solving Problems With Proportions; Author: The Organic Chemistry Tutor;https://www.youtube.com/watch?v=76VruarGn2Q;License: Standard YouTube License, CC-BY
Hypothesis Testing and Confidence Intervals (FRM Part 1 – Book 2 – Chapter 5); Author: Analystprep;https://www.youtube.com/watch?v=vth3yZIUlGQ;License: Standard YouTube License, CC-BY