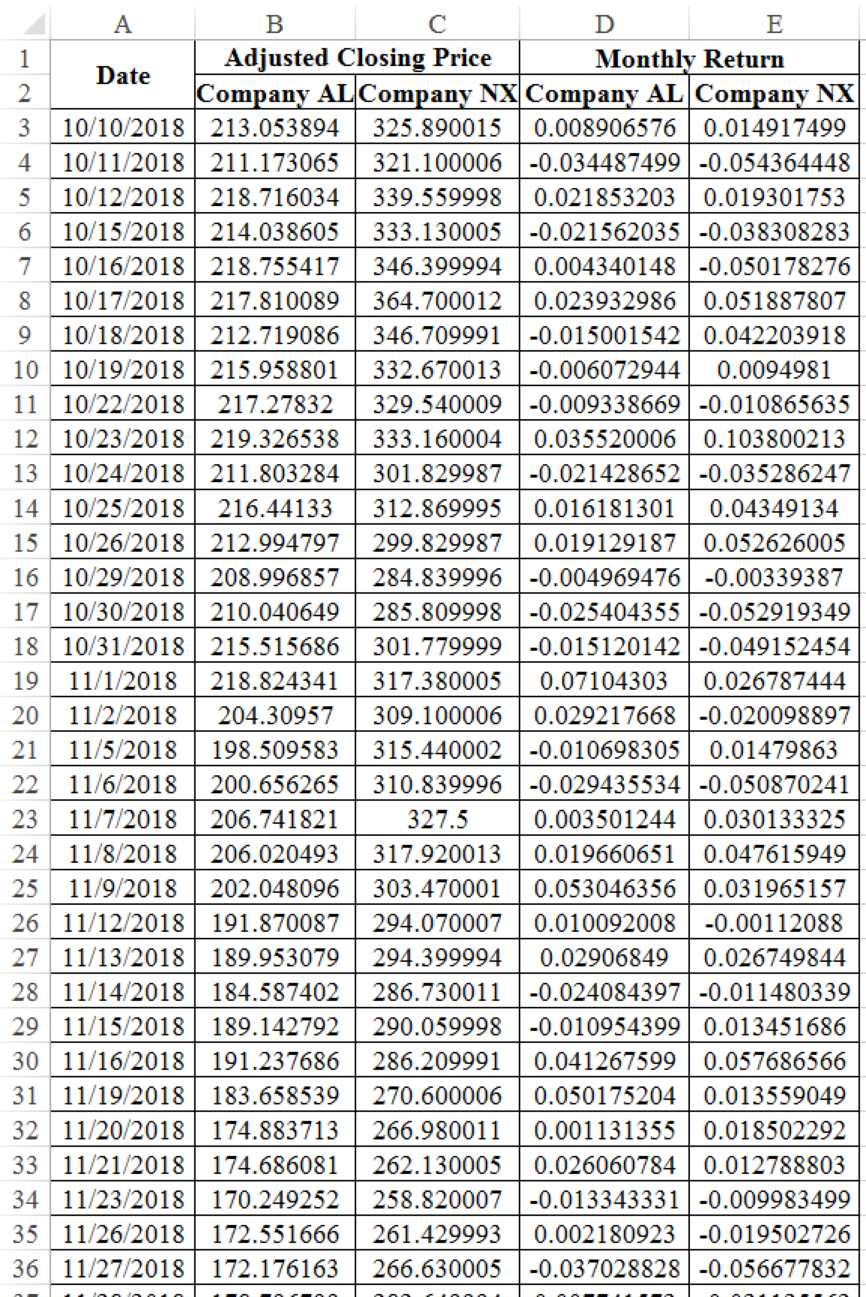
(VAR.P and STDEV.P) Choose two well-known stocks and download the latest 61 months of adjusted prices from finance.yahoo.com. Calculate the monthly returns for each stock. Now find the variance and standard deviation of the returns for each stock by using VAR.P and STDEV.P. Annualize the variance by multiplying by 12 and the standard deviation by multiplying by the square root of 12.
To determine: The variance and standard deviation of two stocks.
Answer to Problem 1SQ
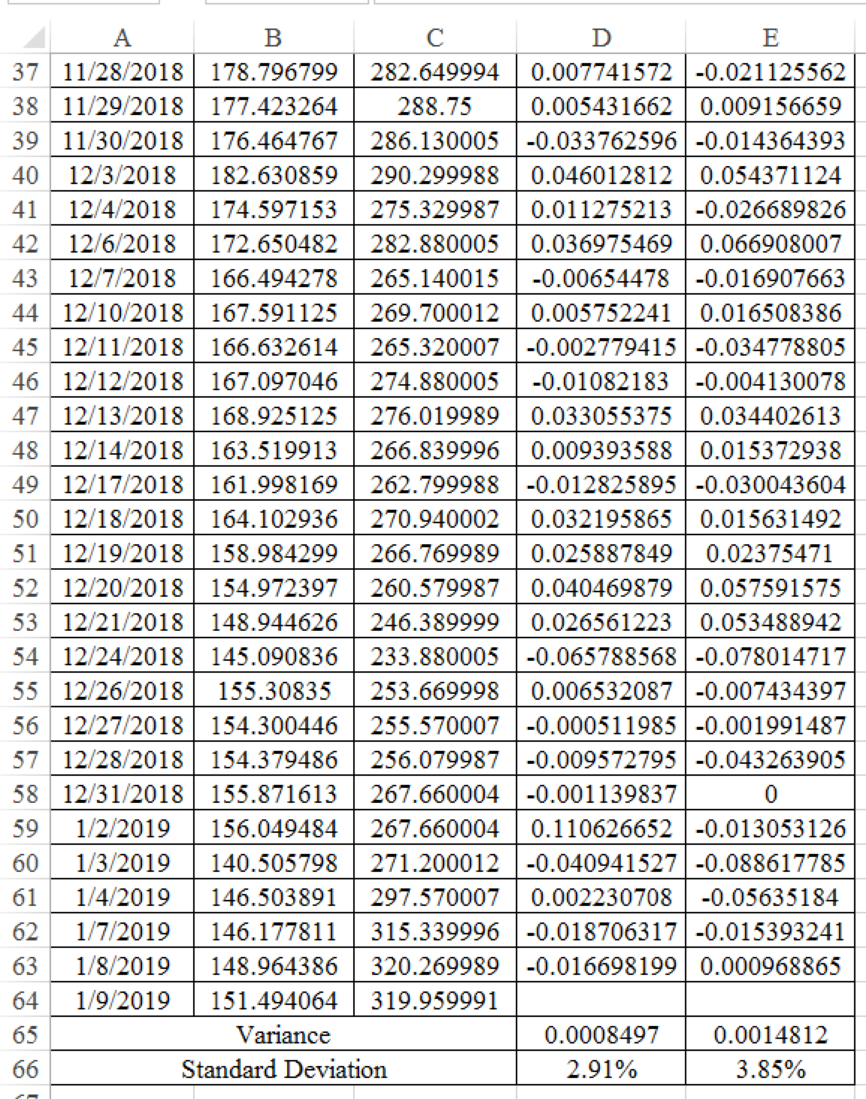
Company AL’s variance is 0.0008497 and standard deviation is 2.91%. Company NX’s variance is 0.0014812 and standard deviation is 3.85%.
Explanation of Solution
Determine the variance and standard deviation of Company AL
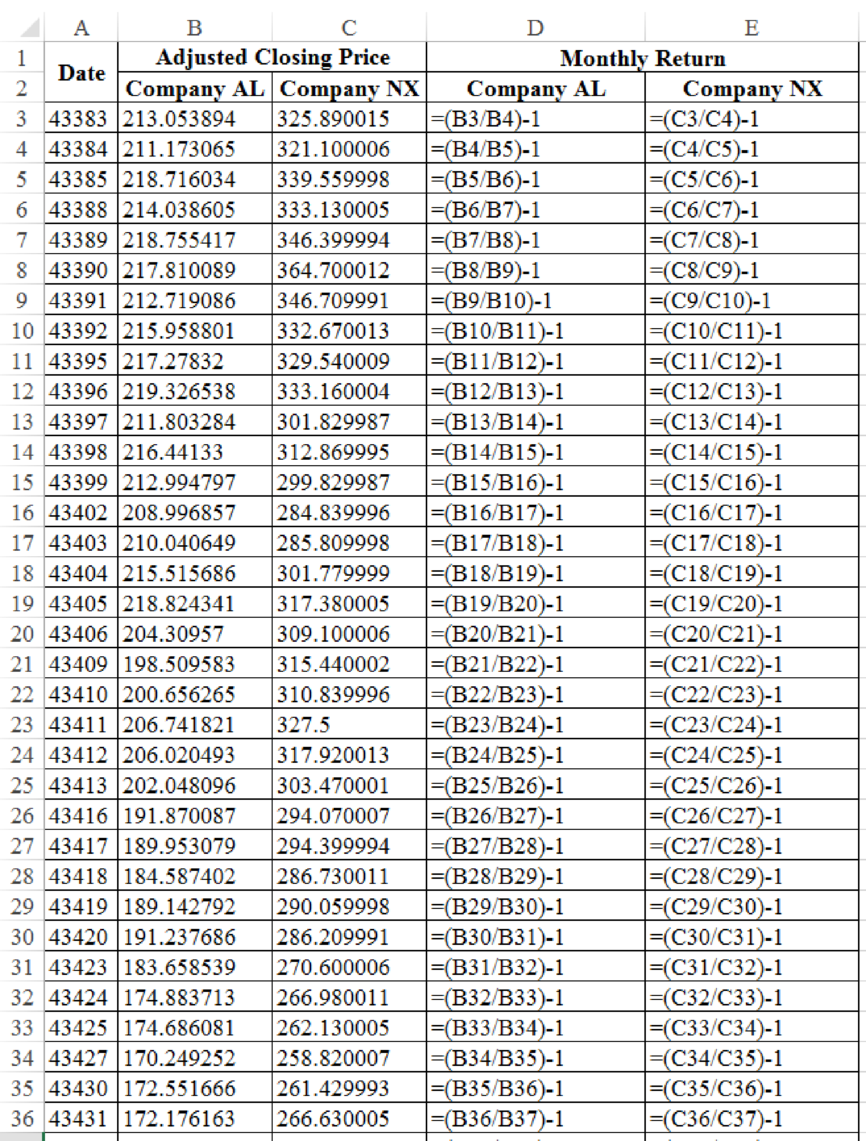
Excel Spreadsheet:
Excel Workings:
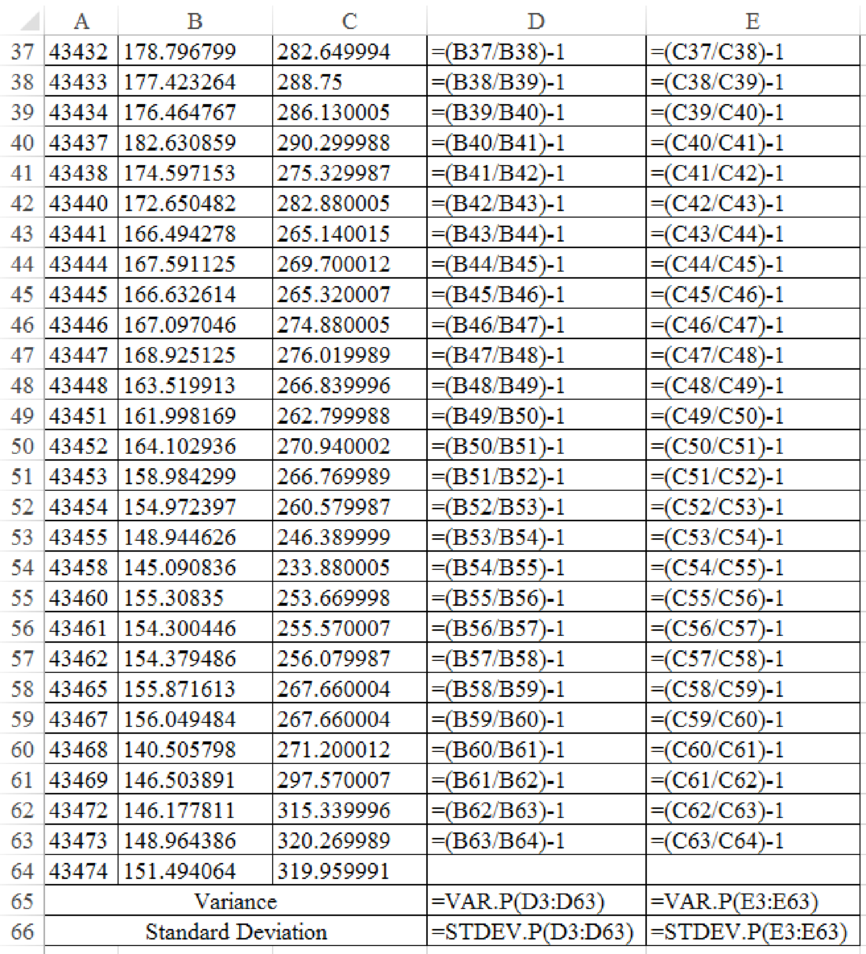
Therefore the Company AL’s variance is 0.0008497 and standard deviation is 2.91%. Company NX’s variance is 0.0014812 and standard deviation is 3.85%.
Want to see more full solutions like this?
Chapter 9 Solutions
Principles of Corporate Finance (Mcgraw-hill/Irwin Series in Finance, Insurance, and Real Estate)
Additional Business Textbook Solutions
Gitman: Principl Manageri Finance_15 (15th Edition) (What's New in Finance)
Corporate Finance (4th Edition) (Pearson Series in Finance) - Standalone book
Corporate Finance (The Mcgraw-hill/Irwin Series in Finance, Insurance, and Real Estate)
Essentials of Corporate Finance (Mcgraw-hill/Irwin Series in Finance, Insurance, and Real Estate)
Fundamentals of Corporate Finance

- Here are the returns on two stocks. A. Calculate the variance and standard deviation of each stock. Which stock is riskier if held on its own? B. Now calculate the returns in each month of a portfolio that invests an equal amount each month in the two stocks C. Is the variance more or less than halfway between the variance of the two Individual stocks?arrow_forwardThe last four years of returns for a stock are as shown here: a. What is the average annual return? b. What is the variance of the stock's returns? c. What is the standard deviation of the stock's returns? Note: Notice that the average return and standard deviation must be entered in percentage format. The variance must be entered in decimal format.arrow_forwardThe last four years of returns for a stock are as shown here: LOADING... . a. What is the average annual return? b. What is the variance of the stock's returns? c. What is the standard deviation of the stock's returns? Note: Notice that the average return and standard deviation must be entered in percentage format. The variance must be entered in decimal format. Question content area bottom Part 1 a. What is the average annual return? The average return is enter your response here%. (Round to two decimal places.) Part 2 b. What is the variance of the stock's returns? The variance of the returns is enter your response here. (Round to five decimal places.) Part 3 c. What is the standard deviation of the stock's returns? The standard deviation is enter your response here%. (Round to two decimal places.) figure Year: 1, 2, 3, 4 Return: -4.2%, +27.9%, +11.8%, +3.8%arrow_forward
- Attached in images are the returns on two stocks: a. Calculate the variance and standard deviation of each stock. (Do not round intermediate calculations. Round your answers to 2 decimal places.) Digital Cheese Return Executive Fruit Return Variance: Standard Deviation: b. Which stock is riskier if held on its own? Digital Cheese or Executive Fruit c. Now calculate the returns in each month of a portfolio that invests an equal amount each month in the two stocks. (Negative amounts should be indicated by a minus sign. Do not round intermediate calculations. Round your answers to 2 decimal places.) Jan. Feb. March April May June July August d. Is the variance more or less than halfway between the variance of the two individual stocks?arrow_forwardThe following shows the expected percentage returns on three stocks over the next six years:Stock Percentage Return (%)Year 1 2 3 4 5 6A 10 5 6 8 12 15B 8 4 4. 80 6.4 9.6 12C 5 10 12 10 6 6 Required:(i) Find the expected return for each of the stock.(ii) Compute the variance and standard deviation for stock A, B and C. Show your working.(iii) Justify how can you minimize the risk of the above combination of stocks. (Must show working method as well)arrow_forwardThe following shows the expected percentage returns on three stocks over the next six years: Stock Percentage Return (%) Year 1 2 3 4 5 6 A 10 5 6 8 12 15 B 8 4 4.8 6.4 9.6 12 C 5 10 12 10 6 6 Required: i Find the expected return for each of the stock. ii Compute the variance and standard deviation for stock A, B and C. Show your working. iii Justify how can you minimize the risk of the above combination of stocks.arrow_forward
- The following table reports the percentage of stocks in a portfolio for nine quarters: a. Construct a time series plot. What type of pattern exists in the data? b. Use trial and error to find a value of the exponential smoothing coefficient that results in a relatively small MSE. c. Using the exponential smoothing model you developed in part (b), what is the forecast of the percentage of stocks in a typical portfolio for the second quarter of year 3?arrow_forwardAn analyst gathered daily stock returns for Feburary 1 through March 31, calculated the Fama-French factors for each day in the sample (SMBt and HMLt), and estimated the Fama-French regression model shown in Equation 6-21. The estimated coefficients were ai = 0, bi = 1.2, ci = 0.4, and di = 1.3. On April 1, the market return was 10%, the return on the SMB portfolio (rSMB) was 3.2%, and the return on the HML portfolio (rHML) was 4.8%. Using the estimated model, what was the stocks predicted return for April 1?arrow_forwardSuppose the index model for stocks A and B is estimated with the following results: rA = 2% + 0.8RM + eA, rB = 2% + 1.2RM + eB, σM = 20%, and RM = rM − rf . The regression R2 of stocks A and B is 0.40 and 0.30, respectively. Answer the following questions. Total: (a) What is the variance of each stock? (b) What is the firm-specific risk of each stock? (c) What is the covariance between the two stocks?arrow_forward
- The following are the monthly rates of return for Madison Cookies and for Sophie Electric during a six-month period. Month Madison Cookies Sophie Electric 1 -0.04 0.07 2 0.06 -0.02 3 -0.07 -0.10 4 0.12 0.15 5 -0.02 -0.06 6 0.05 0.02 Compute the following: a. Average monthly rate of return, Ri, for each stock b. Standard deviation of returns for each stock c. Covariance between the rates of return d. The correlation coefficient between the rates of return What level of correlation would you have expected before performing your calculations? How did your expectations compare with the computed correlation? Would these two stocks be good choices for diversification? Why or why not?arrow_forwardHere are the returns on two stocks. January February March April May June July August Digital Cheese +14 -4 44449 +6 +8 -5 +4 -3 -9 Executive Fruit +8 +2 +5 +12 3643 +3 +6 -4 -3 Required: a-1. Calculate the variance and standard deviation of each stock. a-2. Which stock is riskier if held on its own? b. Now calculate the returns in each month of a portfolio that invests an equal amount each month in the two stocks. c. Is the variance more or less than halfway between the variance of the two individual stocks?arrow_forwardWhat is the average annual return? b. What is the variance of the stock's returns? c. What is the standard deviation of the stock's returns? Note: Notice that the average return and standard deviation must be entered in percentage format. The variance must be entered in decimal format. Year 1 2 3 4 Return (%) Year1: -4.1% Year2: 27.6% Year 3: 12.3% Year 4: 3.6%arrow_forward
 Essentials of Business Analytics (MindTap Course ...StatisticsISBN:9781305627734Author:Jeffrey D. Camm, James J. Cochran, Michael J. Fry, Jeffrey W. Ohlmann, David R. AndersonPublisher:Cengage Learning