
Subpart (a):
Calculate different costs.
Subpart (a):
Explanation of Solution
Total cost (TC) can be obtained by using the following formula.
Total cost at production level 1 unit can be calculated by substituting the respective values in Equation (1).
Total cost is $105.
Average fixed cost (AFC) can be obtained by using the following formula.
Average fixed cost at production level 1 unit can be calculated by substituting the respective values in Equation (2).
Average fixed cost is $60.
Average variable cost at production level 1 unit can be calculated by substituting the respective values in Equation (3).
Average variable cost is $45.
Total average cost (AC) can be obtained by using the following formula.
Total average cost at production level 1 unit can be calculated by substituting the respective values in Equation (4).
Average variable cost is $105.
Marginal cost (MC) can be obtained by using the following formula.
Average variable cost at production level 1 unit can be calculated by substituting the respective values in Equation (5).
Marginal cost is $105.
Table-1 shows the total cost, average fixed cost, average variable cost,
Table -1
| Quantity | Fixed cost | Variable cost | TC | AFC | AVC | AC | MC |
| 0 | 60 | 0 | 60 | ||||
| 1 | 60 | 45 | 105 | 60 | 45.00 | 105.00 | 45 |
| 2 | 60 | 85 | 145 | 30 | 42.50 | 72.50 | 40 |
| 3 | 60 | 120 | 180 | 20 | 40.00 | 60.00 | 35 |
| 4 | 60 | 150 | 210 | 15 | 37.50 | 52.50 | 30 |
| 5 | 60 | 185 | 245 | 12 | 37.00 | 49.00 | 35 |
| 6 | 60 | 225 | 285 | 10 | 37.50 | 47.50 | 40 |
| 7 | 60 | 270 | 330 | 8.57 | 38.57 | 47.14 | 45 |
| 8 | 60 | 325 | 385 | 7.50 | 40.63 | 48.13 | 55 |
| 9 | 60 | 390 | 450 | 6.67 | 43.33 | 50.00 | 65 |
| 10 | 60 | 465 | 525 | 6 | 46.50 | 52.50 | 75 |
Figure -1 illustrates the shape of total fixed cost, total cost and total variable cost that influencing by the diminishing returns to scale.
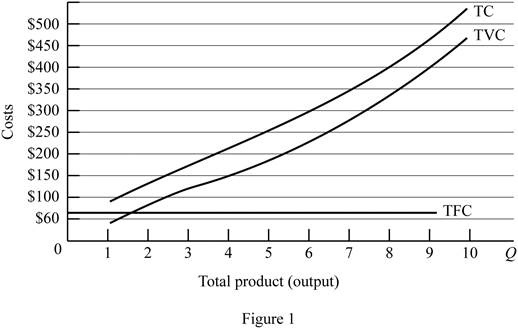
In figure -1, horizontal axis measures total output and vertical axis measures cost. The curve TC indicates total cost and the curve TVC indicates total variable cost. TFC curve indicates total fixed cost. Since total fixed cost is remain the same over the different level of production TFC curve parallel to the horizontal axis.
From the output range 1 unit to 4 units, total cost and total variable cost increasing at decreasing rate due to the increasing marginal returns. Thereafter, these two cost curves are increasing at increasing rate due to the diminishing marginal cost.
Concept introduction:
Fixed cost: Fixed costs refer to those costs that remain the same regardless of the level of production.
Variable cost: Variable cost refers to the costs that change due to the changes occurring in the level of production.
Subpart (b):
Calculate different costs.
Subpart (b):
Explanation of Solution
Figure -2 illustrates relationship between marginal cost, average variable cost, average fixed cost and average total cost curve.
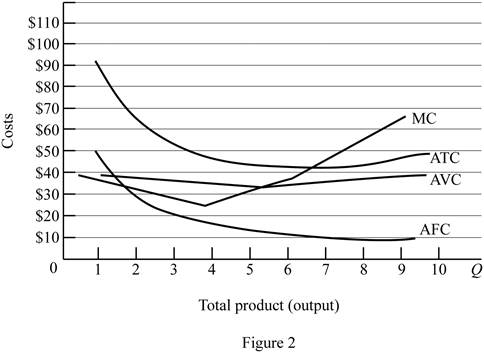
In figure -2, horizontal axis measures total output and vertical axis measures cost. The curve TC indicates total cost and the curve TVC indicates total variable cost. TFC curve indicates total fixed cost. Since total fixed cost is remain the same over the different level of production TFC curve parallel to the horizontal axis.
Since the fixed cost is spread over all the output, increasing the level of output leads to reduce the average fixed cost over the increasing production. Marginal cost curve average variable cost curve and average total cost curve are U shaped due to the operation of economies of scale and diseconomies of scale.
Average total cost curve is the vertical summation of average fixed cost and average variable cost. When the marginal cost curve is below to the average total cost curve, then the average total cost falls. When the marginal cost lies above the average total cost curve then the average total cost curve start rises. Thus, marginal cost curve intersects with the average total cost curve at the minimum point.
When the marginal cost curve is below to the average variable cost curve, then the average variable cost falls. When the marginal cost lies above the average variable cost curve then the average variable cost curve start rises. Thus, marginal cost curve intersects with the average variable cost curve at the minimum point.
Concept introduction:
Fixed cost: Fixed costs refer to those costs that remain the same regardless of the level of production.
Variable cost: Variable cost refers to the costs that change due to the changes occurring in the level of production.
Subpart (c):
Fixed cost and variable cost.
Subpart (c):
Explanation of Solution
The increasing fixed cost from $60 to $100 leads to shifts the fixed cost curve upward (By $40). This increasing fixed cost does not affect the marginal cost. Thus, marginal cost curve and average variable cost curve remains the same.
The decrease in variable cost by $10 leads to reduce the marginal cost $10 at first level of output and remains the same for other level of output. Average total cost and average variable cost decreases as a result of decrease in the variable cost. But, average fixed cost remains the same.
Concept introduction:
Fixed cost: Fixed costs refer to those costs that remain the same regardless of the level of production.
Variable cost: Variable cost refers to the costs that change due to the changes occurring in the level of production.
Want to see more full solutions like this?
Chapter 9 Solutions
Microeconomics

- Refer to the table below. Note that the first column shows variable costs. Quantity Cost Fixed Total Average Average Variable (in dollars) Costs Costs Total Costs Costs (in dollars per 0 1 2 3 4 LO 5 6 0 15 35 60 90 125 160 (in (in (in dollars unit) dollars) dollars) per unit) 40 40 40 40 55 75 37.5 40 100 33.3 40 130 32.5 40 165 33 40 200 33.3 : 15 17.5 20 22.5 25 26.6 Marginal Costs (in dollars per unit) : 15 20 25 30 35 a If the firm produces 5 units that it sells at a price of $30.00 each, what will its profits or losses equal? losses equal $15 profts equal $15 profts equal $25 losses equal $25arrow_forwardThe table below shows cost data for producing different amounts of cough syrup. Use the given information to find the missing cost data. Quantity 0 1 2 3 4 LO 5 Total Cost in $ 120 150 206 556 -> Average Fixed Cost in $ Average Variable Cost in $ 60 30 24 9. 30 22.5 28.6666666666667 47.25 -> Marginal Cost in $ 30 15 103 247 ←arrow_forwardQuestion 4 of 20 Total Average Average Average Output Total Variable Marginal Variable Fixed Total (Q) Fixed Cost Cost Total Cost Cost Cost Cost Cost $0 $500 $200 1 $200 $200 $700 2 $500 $300 $800 $250 $200 3 $500 $1,000 $167 $333 4 $500 $800 $200 $125 For the cost data shown above, what is this firm's Average Total Cost (ATC) when Output is 4? $325 $200 $350 $500arrow_forward
- A firm has fixed costs of $60 and variable costs as indicated in the table below. Complete the table. Total Total Average Average Average Total fixed variable Total fixed variable total Marginal product cost cost cost cost cost cost cost $0 1 45 2 85 3 120 4 150 5 185 6. 225 7 270 8 325 390 10 465 a. Graph total fixed cost, total variable cost, and total cost. Explain how the law of diminishing returns influences the shapes of the total variable-cost and total-cost curves. b. Graph AFC, AVC, ATC, and MC. Explain the derivation and shape of each of these four curves and their relationships to one another. Specifically, explain in nontechnical terms why the MC curve intersects both the AVC and ATC curves at their minimum points. c. Explain how the locations of each of the four curves graphed in question 7b would be altered if (1) total fixed cost had been $100 rather than $60, and (2) total variable cost had been $10 less at each level of output.arrow_forwardThe following is a table of cost for a toy manufacturing firm. The variable input is labor. Use this table to answer the following question. Average variable Average fixed cost Average Variable Quantity of toys Total costs cost total cost costs $0 $20 $10 A $40 В In the cell B, which number is correct? 10 O 5 none of these options is correct O 15arrow_forwardUse the following scenario to answer the questions that follow. Steve owns a bike store. His total costs are $1.2 million per year, his variable costs are $750,000, and his fixed costs are $450,000 per year. Last year, Steve sold 1,200 bikes. Steve's average variable cost was per bike. A) $625 O B) $375 O C) $1,000 D) $1,200arrow_forward
- Refer to Figure 8.6, which shows just three of a firm's various possible short-run average cost curves. Suppose the firm is currently producing 160 units at an average cost of $90 per unit. Which of the following statements is true? $/unit 200 175 150 90 80 R 50 50 O ACI AC2 X 160 130 AC3 Output Figure 8.6 The firm could reduce its short-run average cost by producing less output. The firm is producing the level of output that minimizes short-run average cost. The firm is producing its output at the lowest possible long-run average cost. The firm could reduce its short-run average cost by producing more output.arrow_forwardProduction Total Product Total Fixed Cost Total variable cost Total Cost Average fixed cost Average variable cost Average Total Cost Marginal Cost 0 0 1 25 2 45 3 60 4 70 5 85 6 105 7 135 8 180 9 240 10 315 Assume that fixed costs are $50, labor is the only variable input and its costs are reflected completely in the costs above. Complete the table Graph AFC, AVC, ATC, and MC Explain how increasing returns and decreasing returns are depicted in your graph If the labor input increased by $10 at every unit of production, what would be the effect on your graphs?arrow_forwardQuestion 2 a) Briefly explain why the short run average variable cost of production is U-shaped. b) State the main difference between diminishing returns to a variable factor and decreasing returns to scale in production. c) Consider the production function, q=30Kº4 Lº4, where q is output, K is capital, and Lis labour units. i) What is the returns to scale property of the above production function? ii) Assuming the cost of production is given as C=vK+wL, where v and w are unit prices of capital and labour respectively, find the optimal level of and L that should be employed. 目arrow_forward
- QUESTION 16 Suppose that for a particular firm the only variable input into the production process is labor and that output equals zero when no workers are hired. In addition, suppose that when 5 units of output are produced, the total cost is 175 dirhams, and the average variable cost is 30 dirhams. What would the average fixed cost be if 10 units were produced? a. 4 dirhams. O b.2.5 dirhams. O c. 10 dirhams. O d. 135 dirhams. QUESTION 17 If a company increases production from 1000 to 2000 units and total cost increase from 10000 to 15000 dirhams. How much is the marginal cost? O a. 5000 dirhams. Ob. 1000 dirhams. O c. 5 dirhams. O d. 100 dirhams. QUESTION 18 In a duopoly, if the firms have agreed to jointly maximize profits, then each firm can increase its current profits by producing more. O True O Falsearrow_forward3. Costs in the short run versus in the long run Scooter's Scooters is a large American manufacturer of electric scooters operating out of Spokane. Currently, the company produces all of its scooters using a single manufacturing facility, its factory in town. Recently, management has been considering expanding operations to one or two additional factories. The following table presents the manufacturer's monthly short-run average total cost (SRATC) for various levels of production if it operates out of one, two, or three factories. (Note: Q equals the total quantity of scooters produced by all factories.) Number of Factories Q = 50 Q = 100 1 180 2 3 AVERAGE TOTAL COST (Dollars per scooter) 400 360 Suppose Scooter's Scooters is currently producing 50 scooters per month in its only factory. Its short-run average total cost is $ 320 280 Suppose Scooter's Scooters is expecting to produce 50 scooters per month for several years. In this case, in the long run, it would choose to produce…arrow_forwardThe table shows three short-run cost schedules for three plants of different sizes that a firm might build in the long run. Plant 1 Plant 2 Plant 3 Output ATC Output ATC Output ATC 10 $ 10 10 $ 15 10 $ 20 20 9 20 10 20 15 30 8 30 7 30 10 40 9 40 10 40 8 50 10 50 14 50 9 What is the long-run average cost of producing 20 units of output? Multiple Choice $15 О $10 ○ $34 О $9arrow_forward

 Principles of Economics (12th Edition)EconomicsISBN:9780134078779Author:Karl E. Case, Ray C. Fair, Sharon E. OsterPublisher:PEARSON
 Engineering Economy (17th Edition)EconomicsISBN:9780134870069Author:William G. Sullivan, Elin M. Wicks, C. Patrick KoellingPublisher:PEARSON
 Principles of Economics (MindTap Course List)EconomicsISBN:9781305585126Author:N. Gregory MankiwPublisher:Cengage Learning
 Managerial Economics: A Problem Solving ApproachEconomicsISBN:9781337106665Author:Luke M. Froeb, Brian T. McCann, Michael R. Ward, Mike ShorPublisher:Cengage Learning
 Managerial Economics & Business Strategy (Mcgraw-...EconomicsISBN:9781259290619Author:Michael Baye, Jeff PrincePublisher:McGraw-Hill Education