
a.
The
a.
Answer to Problem 9.7P
The equilibrium price is $400, producer surplus is $20,000 and consumer surplus is $16,000.
Explanation of Solution
The demand for the broccoli is given by,
Equilibrium is a point where the demand and supply curve meet. Hence this point will be,
Hence the equilibrium price is $120. Now substitute this value in above equation, we get,
Hence the equilibrium quantity is 400 units. Now the total expenditure is calculated as follows,
Now the consumer surplus is calculated by as follows,
Hence the consumer surplus is $16,000.
Now the producer surplus is calculated below,
Hence, the producer surplus is $20,000.
Introduction:Consumer surplus is a difference between the amount which consumer actually pays and the amount which he is willing to pay.
Producer surplus is the difference between what the consumer is willing to accept for a given quantity of money or good and the how much a person actually receives by selling the good in the market at the prevailing prices.
b
To describe: The total loss in consumer surplus and producer surplus, provided some values are changed.
b
Answer to Problem 9.7P
Hence the new consumer surplus is $12,000 and new producer surplus is $15,000.
Explanation of Solution
Suppose Q= 300, the total consumer surplus is calculated as follows,
=
Thus the new consumer surplus is $12,000 and it is decreased by the amount of $4,000. Now the producer surplus is calculated by as follows,
Thus the new producer surplus is $15,000 and it is decreased by the amount of $5,000.
Introduction: Consumer surplus is a difference between the amount which consumer actually pays and the amount which he is willing to pay.
Producer surplus is the difference between what the consumer is willing to accept for a given quantity of money or good and the how much a person actually receives by selling the good in the market at the prevailing prices.
c.
To describe: The allocation of producer and consumer surplus between suppliers and demanders are dependent upon the price at which broccoli is sold.
c.
Answer to Problem 9.7P
As the equilibrium price increases, consumer surplus will decreased by $7,000 and producer surplus will increased by $8,800. If price will be $95 then producer surplus is decreased by $8,750 and consumer surplus is decreased by $11,562.50.
Explanation of Solution
Let the equilibrium price P = $140, then consumer surplus is calculated as follows,
As the equilibrium price is increased, the consumer surplus will decreased by $7,000.
Now the producer surplus will be,
As the equilibrium price is increased, producer surplus will increased by $8,800.
Now assume the equilibrium price is $95 then the consumer surplus will be,
Thus consumer surplus is decreased by $11,562.50. Now the producer surplus will be,
Thus, the producer surplus is decreased by $8,750.
Introduction: Consumer surplus is the difference between the amount a consumer spends to purchase a commodity versus the amount he willingly wants to spend on the purchase.
Producer surplus is the difference between what the consumervoluntarily want to accept for a particular amount quantity of money or quantity of good and how much a person actually generates by selling the good in the market at the existing prices.
d.
To describe: The total loss of
d.
Answer to Problem 9.7P
Thus the consumer surplus is increased by $2,000 and producer surplus is increased by $2,500.
Explanation of Solution
Let
Thus the consumer surplus is increased by $2,000. Now calculate the producer surplus,
Thus the producer surplus is increased by $2,500.
Introduction: Equilibriumpoint is that point at which demand and supply curve cut each other. At equilibrium quantity demanded is always equal to quantity supplied.
e.
To describe: The graph of results.
e.
Answer to Problem 9.7P
The graphs of all the results are given below.
Explanation of Solution
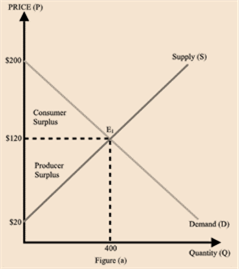
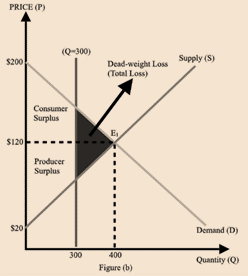
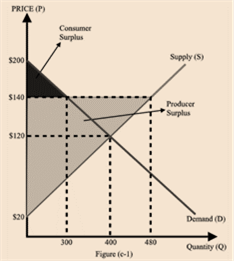
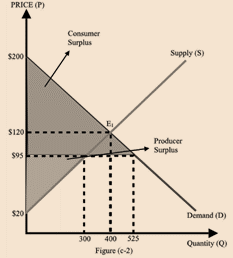
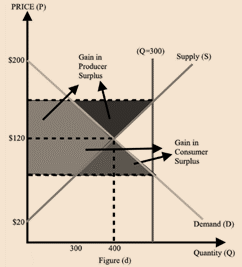
Here, the price shows in Y-axis and quantity shows in X-axis. Here fig (a) shows the equilibrium point at 400 and the equilibrium price is $120. The fig (b) shows that the equilibrium price is reduced to 300 from 400. The blue area shows the loss. The fig (c) shows the variation in equilibrium price from $120 to $95. The fig(d) represents the increased quantity from 300 to 450.
Introduction: Consumer surplus is a difference between the amount which consumer actually pays and the amount which he is willing to pay.
Producer surplus is the difference between what the consumer is willing to accept for a given quantity of money or good and the how much a person actually receives by selling the good in the market at the prevailing prices.
Want to see more full solutions like this?
Chapter 9 Solutions
EBK INTERMEDIATE MICROECONOMICS AND ITS

- The following graph plots the supply and demand curves in the market for polaroid cameras. Use the black point (plus symbol) to indicate the equilibrium price and quantity of polaroid cameras. Then use the green point (triangle symbol) to fill the area representing consumer surplus, and use the purple point (diamond symbol) to fill the area representing producer surplus. (? 400 PRICE (Dollars per camera) Demand 280 240 200 X 160 120 80 Supply + + 85 170 255 340 425 510 595 680 765 850 QUANTITY (Millions of cameras) 360 320 40 0 0 Total surplus in this market is $ million. Equilibrium A Consumer Surplus Producer Surplusarrow_forwardConsider the market for automobiles, and draw representative supply and demand curves.a) Suppose that the price of gasoline rises, and at the same time, the price of steel (an input to automobile production) falls. Show this on your graph. If you have no other information, what can you say about the change in equilibrium price and quantity?b) Now suppose that you have the additional information that the rise in gasoline prices has been relatively large, while the reduction in steel costs has been relatively small. How would this change your answer to (a)? Note:- Do not provide handwritten solution. Maintain accuracy and quality in your answer. Take care of plagiarism. Answer completely. You will get up vote for sure.arrow_forwardWhat is wrong with the following statement? The market supply for natural gas is the sum of all prices that natural gas producers are willing and able to sell at for every quantity.arrow_forward
- Total economic surplus The following graph plots the supply and demand curves in the market for polaroid cameras. Total surplus in this market is _ million? *instructions on how to help* Use the Blackpoint (plus symbol) to indicate the equilibrium price and quantity of Polaroid cameras. then use the green point (triangle symbol) to fill the area, representing consumer surplus and use the purple point ( Diamond symbol) to fill the area of representing producer surplus. Answer then, what is the total surplus in this market.arrow_forwardThe following diagram shows supply and demand in the market for smartphones. Use the black point (plus symbol) to indicate the equilibrium price and quantity of smartphones. Then use the green point (triangle symbol) to fill the area representing consumer surplus, and use the purple point (diamond symbol) to fill the area representing producer surplus. (?) Demand 300 270 Equilibrium 240 210 180 Consumer Surplus 150 120 Producer Surplus 90 60 30 Supply 30 60 90 120 150 180 210 240 270 300 QUANTITY (Millions of phones) Total surplus in this market is $ million. PRICE (Dollars per phone)arrow_forwardSuppose the total demand for wheat and the total supply of wheat per month in the Kansas City grain market are as shown below: Why will $3.40 not be the equilibrium price in this market? Why not $4.90? “Surpluses drive prices up; shortages drive them down.” Do you agree?arrow_forward
- The following graph plots the supply and demand curves in the market for VR headsets. Use the black point (plus symbol) to indicate the equilibrium price and quantity of VR headsets. Then use the green point (triangle symbol) to fill the area representing consumer surplus, and use the purple point (diamond symbol) to fill the area representing producer surplus. PRICE (Dollars per headset) 350 315 280 245 210 175 140 105 70 35 0 0 Demand Supply 40 80 120 160 200 240 280 320 360 QUANTITY (Millions of headsets) Total surplus in this market is $ 400 million. + Equilibrium A Consumer Surplus Producer Surplus ?arrow_forwardSuppose that there are two companies that produce mobile phones: Brand A and Brand B. Explain how each of the following events will affect the market for Brand A phones by using supply and demand diagrams (mention the changes in equilibrium price and quantity): a) Price of Brand B phones increased. b) Brand A's factory's production capacity dropped because of a shortage in raw materials supplies. c) Brand A has developed a new technology that allows to assemble the phone's components in a cheaper way.arrow_forwardSuppose the demand curve for a product is given by MB = 100 - Q and the supply curve for a product is given by MC = 0.25Q, where Q is the quantity demanded/supplied in tons and MB and MC are, respectively, marginal benefit and marginal cost both expressed in US$. Use a graph to help answer the following questions and fill in your final answers in the spaces below. What is the equilibrium quantity? Q* = tons What is the equilibrium price? P* = $ What is the consumer surplus at the equilibrium quantity? CS = $ What is the producer surplus at the equilibrium quantity? PS = $arrow_forward
- Suppose the total demand for wheat and the total supply of wheat per month in the Kansas City grain market are as follows: a. Thousands of bushels demanded 85 80 75 70 65 60 Price per bushel $3.40 3.70 4.00 4.30 4.60 4.90 Thousand of bushels Supplied 72 73 75 77 79 81 Surplus (+) or shortage (-) What will be the market or equilibrium price? What is the equilibrium quantity? Using the surplus-shortage column, explain why your answers are correct. b. Graph the demand for wheat and the supply of wheat. Be sure to label the axes of your graph correctly. Label equilibrium price "P" and the equilibrium quantity "Q." c. Why will $3.40 not be the equilibrium price in this market? Why not $4.90? "Surpluses drive prices up; shortages drive them down." Do you agree? d Now suppose that the government establishes a ceiling price of, say, $3.70 for wheat. Explain carefully the effects of this ceiling price. Demonstrate your answer graphically. What might prompt the government to establish a ceiling…arrow_forwardDraw a graph that indicates what happens in the market for hybrid cars when the price of gasoline increases from $2.50 to $5.00 per gallon. Answer the following questions: a) Does equilibrium output rise or fall? b) Does equilibrium price rise or fall? c) Suppose the supply of hybrid cars is perfectly inelastic. Draw a new graph and explain if and how the elasticity of supply changes your answers to parts “a” and “b”. Note:- Do not provide handwritten solution. Maintain accuracy and quality in your answer. Take care of plagiarism. Answer completely. You will get up vote for sure.arrow_forwardPlease written by computer source Suppose that the demand curve for a product is given by Q = 100 −10p and the supply curve is Q = 10p. Assume that income effects (elasticities) are small so consumer surplus is a good measure of consumer welfare. (a) What is the equilibrium price and quantity with no distortions? (b) The government imposes a tax of $2.00 per unit sold. What is the new equilibrium quantity? Sketch the market equilibrium in a graph. (c) Given the tax what is the change in consumer surplus? What is the change in producer surplus? What is the change in government revenue? What is the net Dead Weight Loss from the tax? (d) Say the government proposes to use the revenue from the tax to pay for snacks in our last ECON 312A lecture. The total social benefits from the snacks would be $82.00. Will the tax increase overall welfare if the revenue is used to buy the snacks? What is the dollar value of the net gain or loss to society?arrow_forward
 Managerial Economics: A Problem Solving ApproachEconomicsISBN:9781337106665Author:Luke M. Froeb, Brian T. McCann, Michael R. Ward, Mike ShorPublisher:Cengage Learning

 Economics (MindTap Course List)EconomicsISBN:9781337617383Author:Roger A. ArnoldPublisher:Cengage Learning
